HIV-1 Nef enhances virus propagation by down-regulating CD4 and SERINC5. However, recent evidence points to the existence of an additional Nef-sensitive restriction mechanism. We now show that Nef suppresses the aberrant cleavage of HIV-1 gp41 by ADAM10, a virion-associated cellular ectodomain sheddase, and thus increases the amount of HIV-1 envelope glycoprotein (Env) on virions. Additionally, Nef inhibits the shedding of at least some cellular ADAM10 substrates, resulting in their accumulation on HIV-1 virions. Whereas Nef+ HIV-1 replicated only marginally better in the absence of ADAM10, the propagation of Nef- HIV-1 was notably rescued in ADAM10- T cell lines. Crucially, Nef- HIV-1 also benefited from the absence of ADAM10 in primary CD4+ T cells. Collectively, our results indicate that ADAM10 negatively affects both laboratory-adapted and primary HIV-1 strains by shedding the ectodomains of viral and cellular transmembrane proteins from virions and that Nef rescues virus replication by counteracting ADAM10.
Product Citations: 6
The ectodomain sheddase ADAM10 restricts HIV-1 propagation and is counteracted by Nef.
In Science Advances on 18 April 2025 by Olety, B., Usami, Y., et al.
HIV-1 replication requires optimal activation of the unfolded protein response.
In FEBS Letters on 1 December 2023 by Tripathi, A., Iyer, K., et al.
Several human diseases including viral infections activate the unfolded protein response (UPR) due to abnormal accumulation of unfolded/misfolded proteins. However, UPR modulation and its functional relevance in HIV-1 infection lack comprehensive elucidation. This study reveals that HIV-1 activates IRE1, PERK, and ATF6 signaling pathways of UPR. The knockdown of PERK and ATF6 reduces HIV-1 long terminal repeat (LTR)-driven gene expression, whereas the endoplasmic reticulum (ER) chaperone HSPA5 prevents proteasomal degradation of HIV-1 p24 through its chaperone activity. Interestingly, overstimulation of UPR by a chemical inducer leads to anti-HIV activity through an enhanced type-1 interferon response. Also, treatment with a chemical ER stress inhibitor reduces HIV-1 replication. These findings suggest that an optimal UPR activation is crucial for effective viral replication, as either overstimulating UPR or inhibiting ER stress leads to viral suppression.
© 2023 Federation of European Biochemical Societies.
In mBio on 15 September 2020 by Zhang, G., Campbell, G. R., et al.
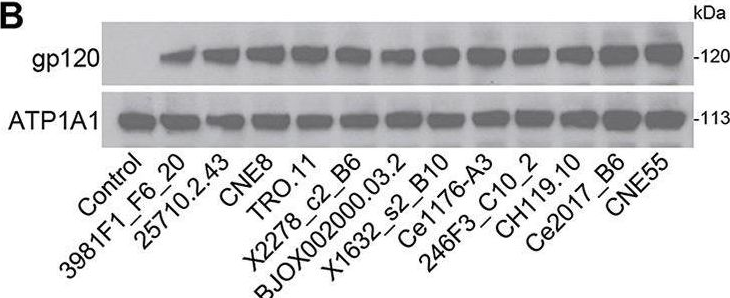
Therapeutic strategies that provide effective and broad-spectrum neutralization against HIV-1 infection are highly desirable. Here, we investigate the potential of nanoengineered CD4+ T cell membrane-coated nanoparticles (TNP) to neutralize a broad range of HIV-1 strains. TNP displayed outstanding neutralizing breadth and potency; they neutralized all 125 HIV-1-pseudotyped viruses tested, including global subtypes/recombinant forms, and transmitted/founder viruses, with a geometric mean 80% inhibitory concentration (IC80) of 819 μg ml-1 (range, 72 to 8,570 μg ml-1). TNP also selectively bound to and induced autophagy in HIV-1-infected CD4+ T cells and macrophages, while having no effect on uninfected cells. This TNP-mediated autophagy inhibited viral release and reduced cell-associated HIV-1 in a dose- and phospholipase D1-dependent manner. Genetic or pharmacological inhibition of autophagy ablated this effect. Thus, we can use TNP as therapeutic agents to neutralize cell-free HIV-1 and to target HIV-1 gp120-expressing cells to decrease the HIV-1 reservoir.IMPORTANCE HIV-1 is a major global health challenge. The development of an effective vaccine and/or a therapeutic cure is a top priority. The creation of vaccines that focus an antibody response toward a particular epitope of a protein has shown promise, but the genetic diversity of HIV-1 hinders this progress. Here we developed an approach using nanoengineered CD4+ T cell membrane-coated nanoparticles (TNP). Not only do TNP effectively neutralize all strains of HIV-1, but they also selectively bind to infected cells and decrease the release of HIV-1 particles through an autophagy-dependent mechanism with no drug-induced off-target or cytotoxic effects on bystander cells.
Copyright © 2020 Zhang et al.
In PLoS Pathogens on 1 April 2018 by Ikeda, T., Symeonides, M., et al.
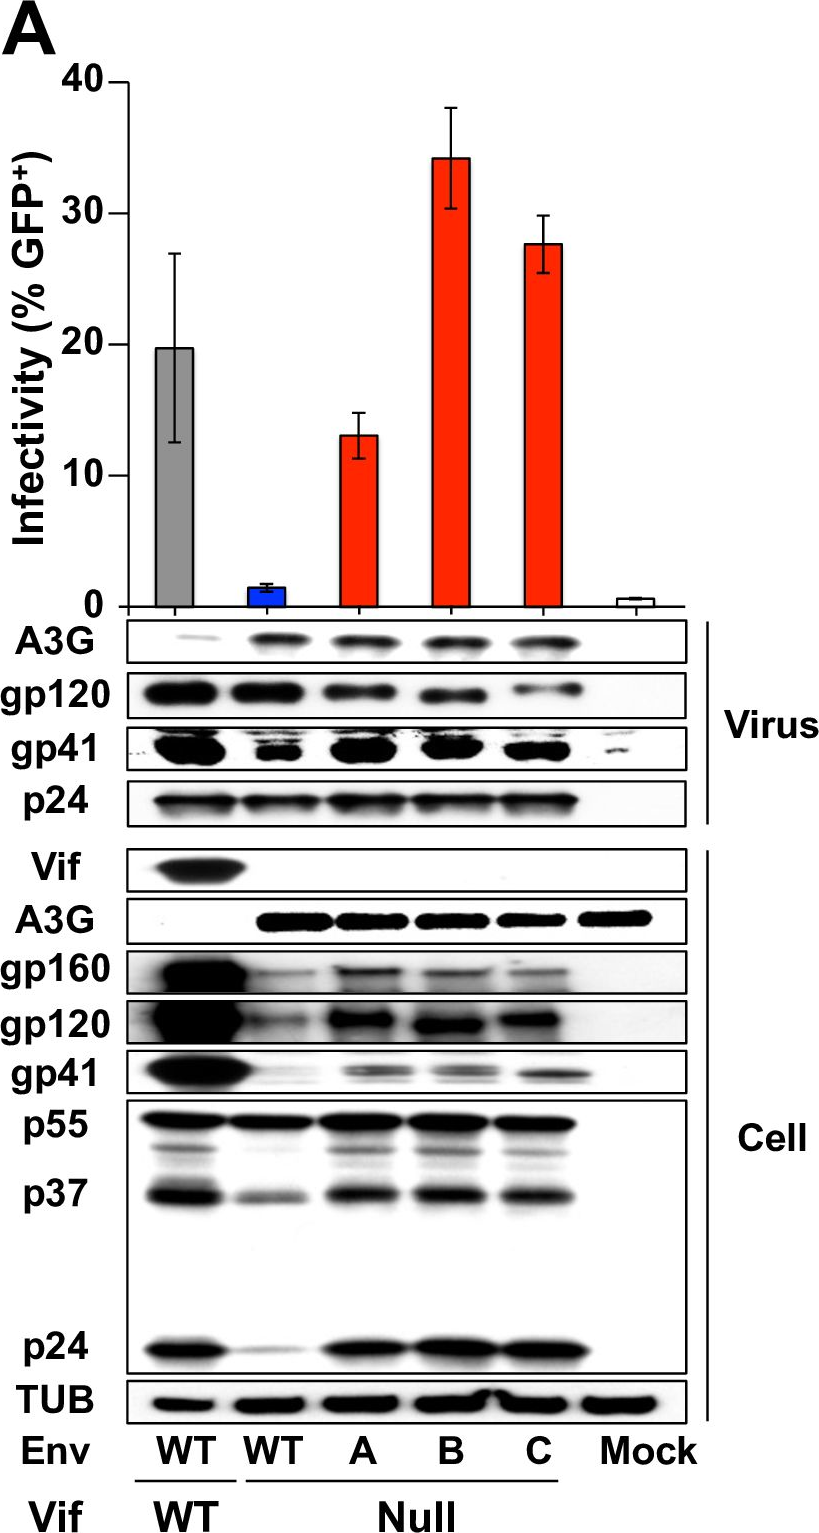
HIV-1 replication normally requires Vif-mediated neutralization of APOBEC3 antiviral enzymes. Viruses lacking Vif succumb to deamination-dependent and -independent restriction processes. Here, HIV-1 adaptation studies were leveraged to ask whether viruses with an irreparable vif deletion could develop resistance to restrictive levels of APOBEC3G. Several resistant viruses were recovered with multiple amino acid substitutions in Env, and these changes alone are sufficient to protect Vif-null viruses from APOBEC3G-dependent restriction in T cell lines. Env adaptations cause decreased fusogenicity, which results in higher levels of Gag-Pol packaging. Increased concentrations of packaged Pol in turn enable faster virus DNA replication and protection from APOBEC3G-mediated hypermutation of viral replication intermediates. Taken together, these studies reveal that a moderate decrease in one essential viral activity, namely Env-mediated fusogenicity, enables the virus to change other activities, here, Gag-Pol packaging during particle production, and thereby escape restriction by the antiviral factor APOBEC3G. We propose a new paradigm in which alterations in viral homeostasis, through compensatory small changes, constitute a general mechanism used by HIV-1 and other viral pathogens to escape innate antiviral responses and other inhibitions including antiviral drugs.
SERINC3 and SERINC5 restrict HIV-1 infectivity and are counteracted by Nef.
In Nature on 8 October 2015 by Usami, Y., Wu, Y., et al.
HIV-1 Nef and the unrelated mouse leukaemia virus glycosylated Gag (glycoGag) strongly enhance the infectivity of HIV-1 virions produced in certain cell types in a clathrin-dependent manner. Here we show that Nef and glycoGag prevent the incorporation of the multipass transmembrane proteins serine incorporator 3 (SERINC3) and SERINC5 into HIV-1 virions to an extent that correlates with infectivity enhancement. Silencing of both SERINC3 and SERINC5 precisely phenocopied the effects of Nef and glycoGag on HIV-1 infectivity. The infectivity of nef-deficient virions increased more than 100-fold when produced in double-knockout human CD4(+) T cells that lack both SERINC3 and SERINC5, and re-expression experiments confirmed that the absence of SERINC3 and SERINC5 accounted for the infectivity enhancement. Furthermore, SERINC3 and SERINC5 together restricted HIV-1 replication, and this restriction was evaded by Nef. SERINC3 and SERINC5 are highly expressed in primary human HIV-1 target cells, and inhibiting their downregulation by Nef is a potential strategy to combat HIV/AIDS.
In MBio on 15 September 2020 by Zhang, G., Campbell, G. R., et al.
Fig.2.B
-
WB
-
Collected and cropped from mBio by CiteAb, provided under a CC-BY license
Image 1 of 2
In PLoS Pathog on 1 April 2018 by Ikeda, T., Symeonides, M., et al.
Fig.3.A
-
WB
-
Homo sapiens (Human)
Collected and cropped from PLoS Pathogens by CiteAb, provided under a CC-BY license
Image 1 of 2