Excessive cardiac fibrosis is a key cause of heart failure and adverse ventricular remodeling after myocardial infarction. The abnormally activated fibroblasts after scar maturation are the chief culprit. Single-cell RNA sequencing of mouse cardiac interstitial cells after myocardial infarction depicts a late-activated fibroblast subpopulation F-Act and initially identifies its characteristic antigen CD248, which is also verified in human hearts. On this basis, we develop a CD248-targeted biotin-binding immune receptor T cell therapy against F-Act to correct cardiac repair disorders. In our study, the precise removal of F-Act after the scar matured effectively inhibits fibrotic expansion in the peri-infarct zone and improves cardiac function. This therapy provides an idea for the treatment of cardiac fibrosis and also promotes the application of engineered T cells to non-tumor diseases.
© 2025. The Author(s).
Product Citations: 633
In Nature Communications on 27 March 2025 by Chen, H., Hu, K., et al.
-
Cardiovascular biology
-
Immunology and Microbiology
Single-cell RNA-seq reveals a resolving immune phenotype in the oral mucosa.
In IScience on 20 September 2024 by Cantalupo, P., Diacou, A., et al.
The oral mucosa is the interface between the host immune response and the oral microbiota. In periodontal disease, the microbial plaque elicits a tissue-destructive immune response. Removal of the microbial stimulus initiates active resolution of inflammatory. Here, we use single-cell RNA-sequencing (scRNA-seq) to characterize the immune response within the oral mucosa across three distinct conditions of periodontal health, disease, and resolution in mice. We report gene expression shifts across the three conditions are driven by macrophage and neutrophils and identify a unique gene signature that characterizes resolution of disease. Macrophage subgroups are identified that demonstrate differential expansion across conditions, including a subgroup that expands during resolution with an immunoregulatory gene signature and enriched for surface marker Cd74. We validate expansion of this subgroup during resolution via flow cytometry. This work presents a robust single-cell dataset of immunological changes in the oral mucosa and identifies a resolution-associated macrophage phenotype in mucosal immunity.
© 2024 The Author(s).
-
Genetics
-
Immunology and Microbiology
In Stem Cell Research & Therapy on 20 February 2024 by Abbas, N., You, K., et al.
Allogeneic hepatocyte transplantation is an emerging approach to treat acute liver defects. However, durable engraftment of the transplanted cells remains a daunting task, as they are actively cleared by the recipient's immune system. Therefore, a detailed understanding of the innate or adaptive immune cells-derived responses against allogeneic transplanted hepatic cells is the key to rationalize cell-based therapies.
Here, we induced an acute inflammatory regenerative niche (3-96 h) on the surface of the liver by the application of cryo-injury (CI) to systematically evaluate the innate immune response against transplanted allogeneic hepatic progenitors in a sustained micro-inflammatory environment.
The resulting data highlighted that the injured site was significantly repopulated by alternating numbers of innate immune cells, including neutrophils, monocytes and Kupffer cells (KCs), from 3 to 96 h. The transplanted allo-HPs, engrafted 6 h post-injury, were collectively eliminated by the innate immune response within 24 h of transplantation. Selective depletion of the KCs demonstrated a delayed recruitment of monocytes from day 2 to day 6. In addition, the intrasplenic engraftment of the hepatic progenitors 54 h post-transplantation was dismantled by KCs, while a time-dependent better survival and translocation of the transplanted cells into the injured site could be observed in samples devoid of KCs.
Overall, this study provides evidence that KCs ablation enables a better survival and integration of allo-HPs in a sustained liver inflammatory environment, having implications for rationalizing the cell-based therapeutic interventions against liver defects.
© 2024. The Author(s).
-
Stem Cells and Developmental Biology
In Cancer Cell International on 18 January 2024 by Wu, S. Y., Yu, W. J., et al.
It is well known that tumor-associated macrophages (TAMs) play essential roles in brain tumor resistance to chemotherapy. However, the detailed mechanisms of how TAMs are involved in brain tumor resistance are still unclear and lack a suitable analysis model.
A BV2 microglial cells with ALTS1C1 astrocytoma cells in vitro co-culture system was used to mimic the microglia dominating tumor stroma in the tumor invasion microenvironment and explore the interaction between microglia and brain tumor cells.
Our result suggested that microglia could form colonies with glioma cells under high-density culturing conditions and protect glioma cells from apoptosis induced by chemotherapeutic drugs. Moreover, this study demonstrates that microglia could hijack drug substances from the glioma cells and reduce the drug intensity of ALTS1C1 via direct contact. Inhibition of gap junction protein prevented microglial-glioma colony formation and microglia-mediated chemoresistance.
This study provides novel insights into how glioma cells acquire chemoresistance via microglia-mediated drug substance transferring, providing a new option for treating chemo-resistant brain tumors.
© 2024. The Author(s).
-
Cancer Research
-
Neuroscience
Preprint on Research Square on 21 November 2023 by Xie, J., Chen, H., et al.
Excessive cardiac fibrosis is a key cause of heart failure and adverse ventricular remodelling after myocardial infarction. The abnormally activated fibroblasts after scar maturation are the chief culprit. Single-cell RNA sequencing of mouse cardiac interstitial cells after myocardial infarction depicts a late-activated fibroblast subpopulation F-Act and initially identifies its characteristic antigen CD248, which is also verified in human hearts. On this basis, we develop a CD248-targeted BBIR-T cell therapy against F-Act to correct cardiac repair disorders. By embedding avidin coupled to the T cell signalling domain onto the membrane, T cells are empowered to recognize and kill target cells labelled by biotinylated antigen-specific molecules. The precise removal of F-Act after the scar matured effectively inhibits fibrotic expansion in the peri-infarct zone and improves cardiac function. This therapy provides a new idea for the treatment of cardiac fibrosis and also promotes the application of engineered T cells to non-tumour diseases.
-
Cardiovascular biology
-
Immunology and Microbiology
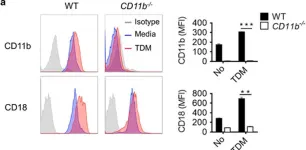
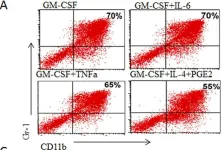
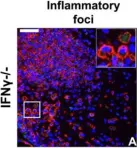
In Exp Mol Med on 5 February 2018 by Zhang, Q., Lee, W. B., et al.
Fig.3.A

-
FC/FACS
-
Collected and cropped from Exp Mol Med by CiteAb, provided under a CC-BY license
Image 1 of 40
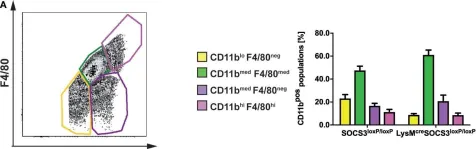
In Front Immunol on 28 November 2017 by Schmok, E., Abad Dar, M., et al.
Fig.5.A

-
FC/FACS
-
Collected and cropped from Front Immunol by CiteAb, provided under a CC-BY license
Image 1 of 40
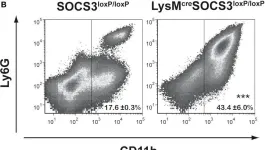
In Front Immunol on 28 November 2017 by Schmok, E., Abad Dar, M., et al.
Fig.1.B

-
FC/FACS
-
Collected and cropped from Front Immunol by CiteAb, provided under a CC-BY license
Image 1 of 40
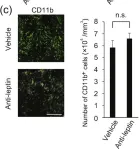
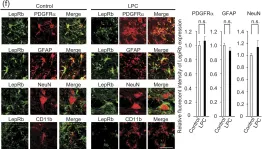
In Sci Rep on 16 January 2017 by Matoba, K., Muramatsu, R., et al.
Fig.3.C

-
IHC-IF
-
Mus musculus (House mouse)
Collected and cropped from Sci Rep by CiteAb, provided under a CC-BY license
Image 1 of 40
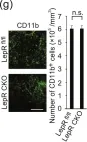
In Sci Rep on 16 January 2017 by Matoba, K., Muramatsu, R., et al.
Fig.2.F

-
IHC-IF
-
Mus musculus (House mouse)
Collected and cropped from Sci Rep by CiteAb, provided under a CC-BY license
Image 1 of 40
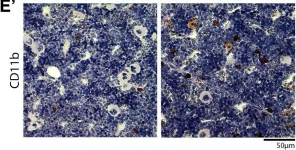
In Sci Rep on 16 January 2017 by Matoba, K., Muramatsu, R., et al.
Fig.4.G

-
IHC-IF
-
Mus musculus (House mouse)
Collected and cropped from Sci Rep by CiteAb, provided under a CC-BY license
Image 1 of 40
In Pflugers Arch on 1 May 2016 by Alvarez-Martins, I., Remédio, L., et al.
Fig.4.E

-
IHC
-
Rattus norvegicus (Rat)
Collected and cropped from Pflugers Arch by CiteAb, provided under a CC-BY license
Image 1 of 40
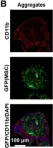
In Stem Cell Res Ther on 10 February 2016 by Bazhanov, N., Ylöstalo, J. H., et al.
Fig.4.B

-
IHC-IF
-
Mus musculus (House mouse)
Collected and cropped from Stem Cell Res Ther by CiteAb, provided under a CC-BY license
Image 1 of 40
In PLoS One on 19 August 2015 by Mei, S., Xin, J., et al.
Fig.2.A

-
FC/FACS
-
Collected and cropped from PLoS One by CiteAb, provided under a CC-BY license
Image 1 of 40
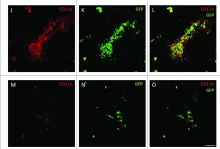
In Oncoimmunology on 1 April 2015 by Yotsumoto, F., You, W. K., et al.
Fig.3.J,K,L,M,N,O,P

-
IHC-IF
-
Mus musculus (House mouse)
Collected and cropped from Oncoimmunology by CiteAb, provided under a CC-BY license
Image 1 of 40
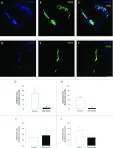
In Oncoimmunology on 1 April 2015 by Yotsumoto, F., You, W. K., et al.
Fig.2.A,B,C,D,E,F,G,H,I,J

-
IHC-IF
-
Mus musculus (House mouse)
Collected and cropped from Oncoimmunology by CiteAb, provided under a CC-BY license
Image 1 of 40
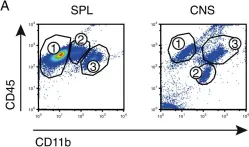
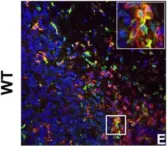
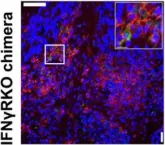
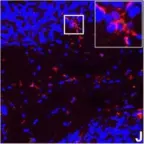
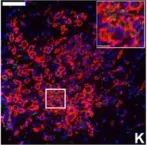
In Acta Neuropathol Commun on 7 March 2014 by Rothhammer, V., Muschaweckh, A., et al.
Fig.2.A

-
FC/FACS
-
Collected and cropped from Acta Neuropathol Commun by CiteAb, provided under a CC-BY license
Image 1 of 40
In J Neuroinflammation on 16 January 2012 by Lee, E., Chanamara, S., et al.
Fig.7.E

-
IHC-IF
-
Mus musculus (House mouse)
Collected and cropped from J Neuroinflammation by CiteAb, provided under a CC-BY license
Image 1 of 40
In J Neuroinflammation on 16 January 2012 by Lee, E., Chanamara, S., et al.
Fig.7.I

-
IHC-IF
-
Mus musculus (House mouse)
Collected and cropped from J Neuroinflammation by CiteAb, provided under a CC-BY license
Image 1 of 40
In J Neuroinflammation on 16 January 2012 by Lee, E., Chanamara, S., et al.
Fig.7.J

-
IHC-IF
-
Mus musculus (House mouse)
Collected and cropped from J Neuroinflammation by CiteAb, provided under a CC-BY license
Image 1 of 40
In J Neuroinflammation on 16 January 2012 by Lee, E., Chanamara, S., et al.
Fig.7.K

-
ICC-IF
-
Mus musculus (House mouse)
Collected and cropped from J Neuroinflammation by CiteAb, provided under a CC-BY license
Image 1 of 40
In J Neuroinflammation on 16 January 2012 by Lee, E., Chanamara, S., et al.
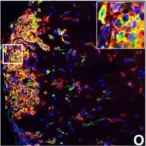
Fig.7.O

-
ICC-IF
-
Mus musculus (House mouse)
Collected and cropped from J Neuroinflammation by CiteAb, provided under a CC-BY license
Image 1 of 40
In J Neuroinflammation on 16 January 2012 by Lee, E., Chanamara, S., et al.
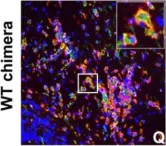
Fig.7.Q

-
ICC-IF
-
Mus musculus (House mouse)
Collected and cropped from J Neuroinflammation by CiteAb, provided under a CC-BY license
Image 1 of 40
In J Neuroinflammation on 16 January 2012 by Lee, E., Chanamara, S., et al.
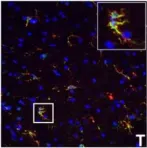
Fig.7.T

-
ICC-IF
-
Mus musculus (House mouse)
Collected and cropped from J Neuroinflammation by CiteAb, provided under a CC-BY license
Image 1 of 40
In J Neuroinflammation on 16 January 2012 by Lee, E., Chanamara, S., et al.
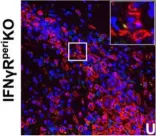
Fig.7.U

-
ICC-IF
-
Mus musculus (House mouse)
Collected and cropped from J Neuroinflammation by CiteAb, provided under a CC-BY license
Image 1 of 40
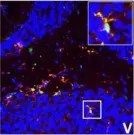
In J Neuroinflammation on 16 January 2012 by Lee, E., Chanamara, S., et al.
Fig.7.V

-
IHC-IF
-
Mus musculus (House mouse)
Collected and cropped from J Neuroinflammation by CiteAb, provided under a CC-BY license
Image 1 of 40
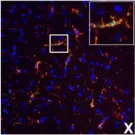
In J Neuroinflammation on 16 January 2012 by Lee, E., Chanamara, S., et al.
Fig.7.X

-
ICC-IF
-
Mus musculus (House mouse)
Collected and cropped from J Neuroinflammation by CiteAb, provided under a CC-BY license
Image 1 of 40
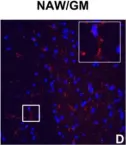
In J Neuroinflammation on 16 January 2012 by Lee, E., Chanamara, S., et al.
Fig.7.D

-
IHC-IF
-
Mus musculus (House mouse)
Collected and cropped from J Neuroinflammation by CiteAb, provided under a CC-BY license
Image 1 of 40
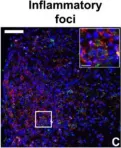
In J Neuroinflammation on 16 January 2012 by Lee, E., Chanamara, S., et al.
Fig.7.C

-
IHC-IF
-
Mus musculus (House mouse)
Collected and cropped from J Neuroinflammation by CiteAb, provided under a CC-BY license
Image 1 of 40
In J Neuroinflammation on 16 January 2012 by Lee, E., Chanamara, S., et al.
Fig.7.A

-
IHC-IF
-
Mus musculus (House mouse)
Collected and cropped from J Neuroinflammation by CiteAb, provided under a CC-BY license
Image 1 of 40