Systemic lupus erythematosus (SLE) is a chronic autoimmune disease characterized by immune-complex deposits and inflammatory cell infiltrations in multiple organs. Approximately half of lupus patients have nephritis. Lymphangiogenesis is the proliferation of lymphatic vessels (LVs), which regulate tissue fluid homeostasis and immune cell trafficking, responding to the tissue environment. In this study, we evaluated the therapeutic effect of SAR131675, a selective VEGFR-3 inhibitor, on the murine lupus nephritis model by regulating inflammation and lymphangiogenesis. We evaluated biopsy-proven lupus nephritis with immunohistochemical staining for D2-40, a marker for human lymphatic endothelial cells. For animal experiments, 7- to 8-week-old male BALB/c mice were used. For the induction of a lupus-like model, the dorsal skin of mice was shaved and given topical treatment every other day with 100 μg resiquimod dissolved in 100 μL acetone during the 8-week treatment. We had renal histology and immunofluorescent study for inflammatory cells and lymphatic vessels. We also had a qRT-PCR and Western blot analysis to evaluate inflammatory cytokines and chemokines, lymphangiogenic factors, and TLR7/type I IFN response. A human study found that the higher the revised ISN/RPS LN histopathological classification and modified NIH activity indexes, the more D2-40 (+) lymphatic vessels were expressed in the tubulointerstitial areas. Inhibition of VEGFR-3 by oral SAR131675 treatment decreased the resiquimod-induced glomerular and tubulointerstitial inflammation and attenuated LYVE-1 (+) lymphatic vessel expression in the murine lupus model. Treatment SAR131675 decreased the resiquimod-induced increase of proinflammatory cytokines and chemokines by regulating TLR7/MyD88/IFN-α expression. This study suggests the therapeutic potential of targeting lymphatic proliferation by VEGFR-3 inhibition in lupus nephritis. Modulation of the lymphatic network may provide a novel approach to treating chronic inflammation and attenuating renal autoimmune response.
© 2025. The Author(s).
Product Citations: 633
In Cell Death Discovery on 12 July 2025 by Wang, T., Li, W., et al.
-
Immunology and Microbiology
In Nature Communications on 1 July 2025 by Perrotta, M., Perrotta, S., et al.
Activated immune cells infiltrate the vasculature during the pathophysiology of hypertension by establishing a vascular-immune interface that contributes to blood pressure dysregulation and organ failure. Many observations indicate a key role of CD8+ T cells in hypertension but mechanisms regulating their activation and interplay with the cardiovascular system are still unknown. In murine model, here we show that a specific member of the phosphoinositide-3-kinases (PI3K) family of lipid kinases, PI3Kγ, is a key intracellular signaling of CD8+ T cells activation and RANTES/CCL5 secretion in hypertension: CCL5-CCR5 signaling is crucial for the establishment of the vascular-immune interface in peripheral organs, lastly contributing to CD8+ tissue infiltration, organ dysfunction and blood pressure elevation. Our studies identify PI3Kγ as a booster of effector CD8+ T cell function, even in the absence of external stimuli. Lastly, an enhanced PI3Kγ signaling mediates the bystander activation of CD8+ T cells and proves effective in transferring the hypertensive phenotype between mice.
© 2025. The Author(s).
-
Cardiovascular biology
-
Immunology and Microbiology
Preprint on BioRxiv : the Preprint Server for Biology on 6 April 2025 by Ruiz, C. F., Ge, X., et al.
SUMMARY High-fat diet (HFD) intake has been linked to an increased risk of pancreatic ductal adenocarcinoma (PDAC), a lethal and therapy-resistant cancer. However, whether and how specific dietary fats drive cancer development remains unresolved. Leveraging an oncogenic Kras -driven mouse model that closely mimics human PDAC progression, we screened a dozen isocaloric HFDs differing solely in fat source and representing the diversity of human fat consumption. Unexpectedly, diets rich in oleic acid – a monounsaturated fatty acid (MUFA) typically associated with good health – markedly enhanced tumorigenesis. Conversely, diets high in polyunsaturated fatty acids (PUFAs) suppressed tumor progression. Relative dietary fatty acid saturation levels (PUFA/MUFA) governed pancreatic membrane phospholipid composition, lipid peroxidation, and ferroptosis sensitivity in mice, concordant with circulating PUFA/MUFA levels being linked to altered PDAC risk in humans. These findings directly implicate dietary unsaturated fatty acids in controlling ferroptosis susceptibility and tumorigenesis, supporting potential “precision nutrition” strategies for PDAC prevention.
-
IHC
In JCI Insight on 22 November 2024 by Saito, S., Nakamura, Y., et al.
Brain arteriovenous malformations (bAVMs) are anomalies forming vascular tangles connecting the arteries and veins, which cause hemorrhagic stroke in young adults. Current surgical approaches are highly invasive, and alternative therapeutic methods are warranted. Recent genetic studies identified KRAS mutations in endothelial cells of bAVMs; however, the underlying process leading to malformation in the postnatal stage remains unknown. Here we established a mouse model of bAVM developing during the early postnatal stage. Among 4 methods tested, mutant KRAS specifically introduced in brain endothelial cells by brain endothelial cell-directed adeno-associated virus (AAV) and endothelial cell-specific Cdh5-CreERT2 mice successfully induced bAVMs in the postnatal period. Mutant KRAS led to the development of multiple vascular tangles and hemorrhage in the brain with increased MAPK/ERK signaling and growth in endothelial cells. Three-dimensional analyses in cleared tissue revealed dilated vascular networks connecting arteries and veins, similar to human bAVMs. Single-cell RNA-Seq revealed dysregulated gene expressions in endothelial cells and multiple cell types involved in the pathological process. Finally, we employed CRISPR/CasRx to knock down mutant KRAS expression, which efficiently suppressed bAVM development. The present model reveals pathological processes that lead to postnatal bAVMs and demonstrates the efficacy of therapeutic strategies with CRISPR/CasRx.
-
IHC
-
Mus musculus (House mouse)
In Cell Reports Medicine on 16 July 2024 by Perruzza, L., Rezzonico Jost, T., et al.
Environmental enteric dysfunction (EED) is a condition associated with malnutrition that can progress to malabsorption and villous atrophy. Severe EED results in linear growth stunting, slowed neurocognitive development, and unresponsiveness to oral vaccines. Prenatal exposure to malnutrition and breast feeding by malnourished mothers replicates EED. Pups are characterized by deprivation of secretory IgA (SIgA) and altered development of the gut immune system and microbiota. Extracellular ATP (eATP) released by microbiota limits T follicular helper (Tfh) cell activity and SIgA generation in Peyer's patches (PPs). Administration of a live biotherapeutic releasing the ATP-degrading enzyme apyrase to malnourished pups restores SIgA levels and ameliorates stunted growth. SIgA is instrumental in improving the growth and intestinal immune competence of mice while they are continuously fed a malnourished diet. The analysis of microbiota composition suggests that amplification of endogenous SIgA may exert a dominant function in correcting malnourishment dysbiosis and its consequences on host organisms, irrespective of the actual microbial ecology.
Copyright © 2024 The Author(s). Published by Elsevier Inc. All rights reserved.
-
Mus musculus (House mouse)
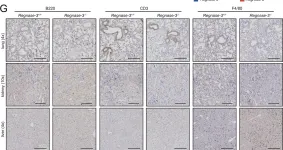
In J Exp Med on 1 July 2019 by von Gamm, M., Schaub, A., et al.
Fig.2.G

-
IHC
-
Collected and cropped from J Exp Med by CiteAb, provided under a CC-BY license
Image 1 of 4
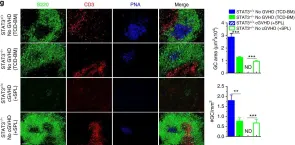
In Nat Commun on 17 October 2017 by Deng, R., Hurtz, C., et al.
Fig.7.G

-
ICC-IF
-
Collected and cropped from Nat Commun by CiteAb, provided under a CC-BY license
Image 1 of 4
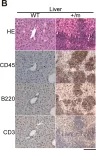
In PLoS One on 19 February 2013 by Mito, T., Kikkawa, Y., et al.
Fig.5.B

-
IHC-P
-
Mus musculus (House mouse)
Collected and cropped from PLoS One by CiteAb, provided under a CC-BY license
Image 1 of 4
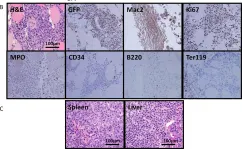
In PLoS One on 7 September 2012 by Liu, J., Hettmer, S., et al.
Fig.5.B

-
IHC
-
Mus musculus (House mouse)
Collected and cropped from PLoS One by CiteAb, provided under a CC-BY license
Image 1 of 4