
Cyclic AMP-dependent protein kinase A (PKA) is recognized for its pivotal involvement in various cancer types, with Protein Kinase Inhibitor Beta (PKIB) serving as an endogenous inhibitor that curtails PKA activity. Despite the documented escalation of PKIB expression in several malignancies, a comprehensive understanding of its precise mechanistic implications in human cancers remains elusive. This investigation is centered on bladder cancer (BLCA), unveiling an augmented expression of PKIB concomitant with heightened BLCA cell proliferation, migration, and invasion in vitro and augmented tumorigenic potential in an in vivo model. Mechanistically, PKIB disrupts PKA kinase activity, thereby resulting in diminished phosphorylation of the substrate target protein HSP27 at serine 15, 78, and 82. Additionally, the transcription factor MYCN exhibits an affinity for the PKIB promoter, leading to its enhanced expression in the context of BLCA. These findings reveal the oncogenic proclivity of PKIB and introduce a novel signalling pathway in BLCA, providing valuable insights into potential therapeutic targets for precise intervention.
© 2025. The Author(s).
Product Citations: 259
In Cell Death & Disease on 1 July 2025 by Liu, X., Yin, X., et al.
-
WB
-
Homo sapiens (Human)
-
Cancer Research
-
Cell Biology
EMT induction in normal breast epithelial cells by COX2-expressing fibroblasts.
In Cell Communication and Signaling : CCS on 22 May 2025 by Kang, M., Devarasou, S., et al.
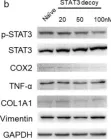
The tumor microenvironment (TME) plays a pivotal role in cancer progression, with cancer-associated fibroblasts (CAFs) significantly influencing tumor behavior. Especially, elevated COX2 expressing fibroblasts within the TME, notably in collagen-dense tumors like breast cancer, has been recently emphasized in the literature. However, the specific effect of COX2-expressing CAFs (COX2+ CAFs) on neighboring cells and their consequent role in cancer progression is not fully elucidated.
We induced COX2+ fibroblasts by forcing the fibroblasts forming aggregates to undergo Nemosis as a proxy for COX2+ CAFs. This approach enabled us to simulate the paracrine interactions between COX2+ CAFs and normal breast epithelial cells via conditioned media from COX2+ fibroblasts. We developed an innovative in vitro platform that combines cell mechanics-based analysis and biomolecular assays to study the interactions between COX2+ fibroblasts and normal breast epithelial cells. By focusing on the mechanical characteristics of the cells and the epithelial-mesenchymal transition (EMT) marker expressions, we aimed to elucidate the paracrine mechanisms through which COX2+ CAFs influence the tumor microenvironment.
Our in vitro findings demonstrate that COX2+ fibroblasts, through conditioned media, induce significant alterations in the mechanical behavior of normal breast epithelial cells, as evidenced by monolayer expansion measurements using traction force microscopy (TFM). This transition was further corroborated by single-cell morphology and motility analyses, as well as increased expression of mesenchymal markers, including SNAI1 at the mRNA level and vimentin at the protein level. EP4 inhibition partially reversed these changes, preserving cell-cell interactions, limiting monolayer expansion, and reducing mesenchymal-like features, suggesting that PGE2-EP4 signaling plays a key role in mediating the paracrine effects of COX2+ fibroblasts. Together, our findings support a model in which PGE2-EP4 signaling contributes to EMT induction, potentially involving SNAI1 regulation, with implications for targeting stromal-epithelial interactions in breast cancer.
This study advances our understanding of the potential mechanisms by which COX2+ CAFs influence tumor progression within the breast tumor microenvironment (TME) through controlled in vitro investigations. By integrating cell mechanics-based analysis, biomolecular assays, and innovative in vitro cell-based modeling of COX2+ CAFs, we have delineated the contributory role of these cells in a controlled setting. These insights lay a groundwork for future studies that could explore the implications of these findings in vivo, potentially guiding targeted therapeutic strategies.
© 2025. The Author(s).
-
WB
-
ICC-IF
-
Homo sapiens (Human)
-
Endocrinology and Physiology
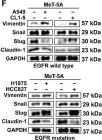
TLE1 corepressor promotes gefitinib resistance in lung cancer A549 cells via E‑cadherin silencing.
In Biomedical Reports on 1 March 2025 by Yao, X., Roberts, N., et al.
As a putative lung specific oncogene, the transducin-like enhancer of split 1 (TLE1) corepressor drives an anti-apoptotic and pro-epithelial-mesenchymal transition (EMT) gene transcriptional programs in human lung adenocarcinoma (LUAD) cells, thereby promoting anoikis resistance and tumor aggressiveness. Through its survival- and EMT-promoting gene regulatory programs, TLE1 may impact drug sensitivity and resistance in lung cancer cells. In the present study, a novel function of TLE1 was uncovered as an inhibitor of the antitumor effects of the epidermal growth factor receptor tyrosine kinase inhibitor (EGFR-TKI) gefitinib in the human LUAD cell line A549, which exhibits moderate sensitivity to EGFR-TKI. While upregulation of TLE1 expression potently inhibited the proliferation inhibitory and apoptotic effects of gefitinib in A549 cells, downregulation of endogenous TLE1 in these cells enhanced their sensitivity to gefitinib. In experimentally derived gefitinib-resistant A549 cells (A549GR) that have acquired EMT, TLE1 expression is upregulated as compared with parental A549 cells, and acute ablation of TLE1 expression is sufficient to partially restore gefitinib sensitivity and attenuate EMT phenotype. Mechanistic studies showed that TLE1 confers gefitinib resistance in A549 cells in part via downregulation of E-cadherin, a known potentiator of EGFR-TKI sensitivity and apoptosis induction. Importantly, the TLE1/E-cadherin transcriptional axis is negatively regulated by gefitinib to trigger apoptosis via the Bcl-2-inhibitor of transcription 1 cell death pathway. In conclusion, these results indicate a novel role of TLE1 in modulating EGFR-TKI sensitivity in lung cancer cells via regulation of E-cadherin expression, and its upregulation may potentiate EGFR-TKI resistance in LUAD.
Copyright: © 2025 Yao et al.
-
Homo sapiens (Human)
-
Cancer Research
In Nature Communications on 26 February 2025 by Gao, G., Shi, Y., et al.
Dysregulation of mitochondrial function has been implicated in Parkinson's disease (PD), but the role of mitochondrial metabolism in disease pathogenesis remains to be elucidated. Using an unbiased metabolomic analysis of purified mitochondria, we identified alterations in α-ketoglutarate dehydrogenase (KGDH) pathway upon loss of PD-linked CHCHD2 protein. KGDH, a rate-limiting enzyme complex in the tricarboxylic acid cycle, was decreased in CHCHD2-deficient male mouse brains and human dopaminergic neurons. This deficiency of KGDH led to elevated α-ketoglutarate and increased lipid peroxidation. Treatment of CHCHD2-deficient dopaminergic neurons with lipoic acid, a KGDH cofactor and antioxidant agent, resulted in decreased levels of lipid peroxidation and phosphorylated α-synuclein. CHCHD10, a close homolog of CHCHD2 that is primarily linked to amyotrophic lateral sclerosis/frontotemporal dementia, did not affect the KGDH pathway or lipid peroxidation. Together, these results identify KGDH metabolic pathway as a targetable mitochondrial mechanism for correction of increased lipid peroxidation and α-synuclein in Parkinson's disease.
© 2025. The Author(s).
-
Cell Biology
-
Neuroscience
Micro Immune Response On-chip (MIRO) models the tumour-stroma interface for immunotherapy testing.
In Nature Communications on 3 February 2025 by Perucca, A., Llonín, A. G., et al.
Immunotherapies are beneficial for a considerable proportion of cancer patients, but ineffective in others. In vitro modelling of the complex interactions between cancer cells and their microenvironment could provide a path to understanding immune therapy sensitivity and resistance. Here we develop MIRO, a fully humanised in vitro platform to model the spatial organisation of the tumour/stroma interface and its interaction with immune cells. We find that stromal barriers are associated with immune exclusion and protect cancer cells from antibody-dependent cellular cytotoxicity, elicited by targeted therapy. We demonstrate that IL2-driven immunomodulation increases immune cell velocity and spreading to overcome stromal immunosuppression and restores anti-cancer response in refractory tumours. Collectively, our study underscores the translational value of MIRO as a powerful tool for exploring how the spatial organisation of the tumour microenvironment shapes the immune landscape and influences the responses to immunomodulating therapies.
© 2025. The Author(s).
-
Homo sapiens (Human)
-
Cancer Research
-
Immunology and Microbiology
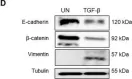
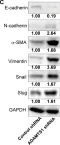
In Molecules on 25 January 2024 by Choi, H. J., Kim, Y. A., et al.
Fig.2.B

-
WB
-
Collected and cropped from Molecules by CiteAb, provided under a CC-BY license
Image 1 of 85
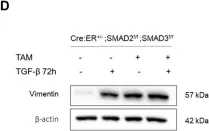
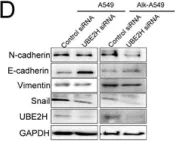
In Theranostics on 31 August 2023 by Wu, Y. Y., Hsu, Y. L., et al.
Fig.2.F

-
WB
-
Homo sapiens (Human)
Collected and cropped from Theranostics by CiteAb, provided under a CC-BY license
Image 1 of 85
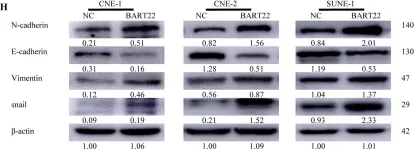
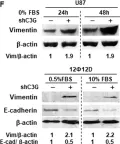
In Cancers (Basel) on 6 April 2023 by Chen, L., Chau, W. Y., et al.
Fig.2.C

-
WB
-
Collected and cropped from Cancers (Basel) by CiteAb, provided under a CC-BY license
Image 1 of 85
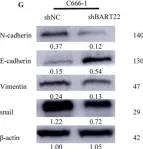
In Int J Mol Sci on 27 December 2022 by Chang, C. Y., Huang, Y. C., et al.
Fig.7.F

-
WB
-
Collected and cropped from Int J Mol Sci by CiteAb, provided under a CC-BY license
Image 1 of 85
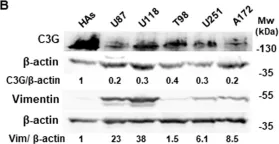
In Sci Rep on 1 September 2022 by Ruiz-Mitjana, A., Navaridas, R., et al.
Fig.3.D

-
WB
-
Mus musculus (House mouse)
Collected and cropped from Sci Rep by CiteAb, provided under a CC-BY license
Image 1 of 85
In Sci Rep on 1 September 2022 by Ruiz-Mitjana, A., Navaridas, R., et al.
Fig.6.D

-
WB
-
Mus musculus (House mouse)
Collected and cropped from Sci Rep by CiteAb, provided under a CC-BY license
Image 1 of 85
In Cell Death Dis on 30 July 2022 by Zhang, T., Chen, Z., et al.
Fig.4.H

-
WB
-
Homo sapiens (Human)
Collected and cropped from Cell Death Dis by CiteAb, provided under a CC-BY license
Image 1 of 85
In Cell Death Dis on 30 July 2022 by Zhang, T., Chen, Z., et al.
Fig.5.G

-
WB
-
Homo sapiens (Human)
Collected and cropped from Cell Death Dis by CiteAb, provided under a CC-BY license
Image 1 of 85
In Cell Death Dis on 30 July 2022 by Zhang, T., Chen, Z., et al.
Fig.6.G

-
WB
-
Homo sapiens (Human)
Collected and cropped from Cell Death Dis by CiteAb, provided under a CC-BY license
Image 1 of 85
In Cell Death Dis on 30 July 2022 by Zhang, T., Chen, Z., et al.
Fig.7.J

-
WB
-
Homo sapiens (Human)
Collected and cropped from Cell Death Dis by CiteAb, provided under a CC-BY license
Image 1 of 85
In Mol Oncol on 1 June 2022 by Megino-Luque, C., Sisó, P., et al.
Fig.5.G

-
WB
-
Collected and cropped from Mol Oncol by CiteAb, provided under a CC-BY license
Image 1 of 85
In Mol Oncol on 1 June 2022 by Megino-Luque, C., Sisó, P., et al.
Fig.3.E

-
WB
-
Collected and cropped from Mol Oncol by CiteAb, provided under a CC-BY license
Image 1 of 85
In Biology (Basel) on 16 May 2022 by Lee, H. C., Chang, C. Y., et al.
Fig.7.C

-
WB
-
Collected and cropped from Biology (Basel) by CiteAb, provided under a CC-BY license
Image 1 of 85
In Biology (Basel) on 28 April 2021 by Yen, M. C., Wu, K. L., et al.
Fig.3.D

-
WB
-
Collected and cropped from Biology (Basel) by CiteAb, provided under a CC-BY license
Image 1 of 85
In Cell Death Dis on 6 April 2021 by Manzano, S., Gutiérrez-Uzquiza, A., et al.
Fig.2.F

-
WB
-
Collected and cropped from Cell Death Dis by CiteAb, provided under a CC-BY license
Image 1 of 85
In Cell Death Dis on 6 April 2021 by Manzano, S., Gutiérrez-Uzquiza, A., et al.
Fig.1.B

-
WB
-
Collected and cropped from Cell Death Dis by CiteAb, provided under a CC-BY license
Image 1 of 85
In Cancers (Basel) on 2 February 2021 by Bartkowiak, K., Heidrich, I., et al.
Fig.2.E

-
WB
-
Homo sapiens (Human)
Collected and cropped from Cancers (Basel) by CiteAb, provided under a CC-BY license
Image 1 of 85
In Cancers (Basel) on 2 February 2021 by Bartkowiak, K., Heidrich, I., et al.
Fig.2.B

-
WB
-
Homo sapiens (Human)
Collected and cropped from Cancers (Basel) by CiteAb, provided under a CC-BY license
Image 1 of 85
In Int J Mol Sci on 31 December 2020 by Chen, C., Kawasumi, M., et al.
Fig.1.C

-
WB
-
Collected and cropped from Int J Mol Sci by CiteAb, provided under a CC-BY license
Image 1 of 85
In PLoS One on 23 October 2020 by Song, J. H., Eum, D. Y., et al.
Fig.2.B

-
WB
-
Collected and cropped from PLoS One by CiteAb, provided under a CC-BY license
Image 1 of 85
In PLoS One on 23 October 2020 by Song, J. H., Eum, D. Y., et al.
Fig.5.D

-
WB
-
Collected and cropped from PLoS One by CiteAb, provided under a CC-BY license
Image 1 of 85
In J Cancer on 10 October 2020 by Yang, W., Feng, W., et al.
Fig.3.A

-
WB
-
Homo sapiens (Human)
Collected and cropped from J Cancer by CiteAb, provided under a CC-BY license
Image 1 of 85
In J Cancer on 10 October 2020 by Yang, W., Feng, W., et al.
Fig.4.D

-
WB
-
Collected and cropped from J Cancer by CiteAb, provided under a CC-BY license
Image 1 of 85
In J Cancer on 10 October 2020 by Yang, W., Feng, W., et al.
Fig.3.B

-
WB
-
Homo sapiens (Human)
Collected and cropped from J Cancer by CiteAb, provided under a CC-BY license
Image 1 of 85
In J Cancer on 10 October 2020 by Yang, W., Feng, W., et al.
Fig.4.B

-
WB
-
Homo sapiens (Human)
Collected and cropped from J Cancer by CiteAb, provided under a CC-BY license
Image 1 of 85