A high fat diet (HFD) leads to lesions of the gastric epithelium and causes a proinflammatory environment. Fibroblast growth factor 23 (FGF23), a bone hormone, regulates renal phosphate and vitamin D metabolism. Under pathophysiological conditions production of FGF23 is stimulated. HFD feeding elevates serum FGF23 levels through inflammation.
We aimed to investigate whether HFD feeding and obesity is associated with gastric FGF23 production.
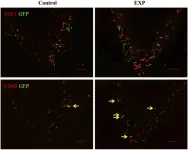
Mice were fed a standard diet or HFD for 12 weeks (long-term) or 1 week (short-term), and the stomachs were then examined. Additionally, corpus specimens from patients with obesity, human umbilical vein endothelial cells (HUVECs), and normal human gastric epithelial cells (GES-1) were studied. FGF23 production was examined by qPCR and Western blotting, mucosal integrity assessed by fluorescence microscopy, and FGF23-expressing cells analyzed by immunohistochemistry.
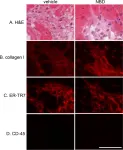
In mice, HFD feeding up-regulated Fgf23 expression and FGF23 protein abundance in the proximal glandular stomach. FGF23-positive cells were detected in damaged glandular and interglandular areas representing mucus-like cells, endothelial cells of interconnected blood vessels or stromal endothelial cells and myofibroblasts. FGF23 expression was associated with impaired tissue integrity, immune cell infiltration and lipid deposition, with less pronounced mucosal changes upon short-term HFD feeding. Gastric FGF23 was also detectable in patients with obesity, mainly in endothelial cells of dilated and interconnected vessels. In HUVECs, pro-angiogenic adipokine leptin ramped up FGF23 transcript levels. In GES-1 cells, proinflammatory cytokine interleukin-1β (IL-1β) tended to enhance FGF23 expression.
HFD feeding stimulates gastric FGF23 production and, in particular, increases the number of FGF23-expressing endothelial and epithelial cells.
© 2025. The Author(s).
Product Citations: 719
High fat diet induces gastric production of fibroblast growth factor 23 (FGF23).
In International Journal of Obesity (2005) on 7 June 2025 by Widmayer, P., Feger, M., et al.
-
IHC
Preprint on BioRxiv : the Preprint Server for Biology on 12 April 2025 by Flandrin, O., Yang, Y., et al.
Purpose: Previously we showed that transient receptor potential ion channels TRPA1 and TRPV1 selectively protect the cornea against bacterial adhesion, with TRPA1 countering the Gram-negative pathogen Pseudomonas aeruginosa and TRPV1 countering environmental bacteria. Here, we explored parameters of this specificity using a Gram-positive pathogen Staphylococcus aureus. Methods: Healthy corneas of C57BL/6J wild-type (WT), TRPA1 (-/-) or TRPV1 (-/-) mice were challenged with S. aureus for 4 or 6 hours. Some experiments instead/also used resiniferatoxin (RTX) to deplete TRPV1-expressing nerves, JNJ-17203212 to selectively antagonize TRPV1, or the anesthetic bupivacaine to inhibit nerve firing. Adherent bacteria were quantified using FISH labeling (16S rRNA-targeted probe). Lyz2+, CD11c+ and CD45+ cells were visualized/quantified using hybrid mT/mG + LysMcre mice (red cell membranes; Lyz2+-GFP), CD11c+-YFP mice, and anti-CD45-antibody respectively. Results: Corneas of TRPV1 (-/-) not TRPA1 (-/-) mice were found more susceptible to S. aureus adhesion compared to WT. Accordingly, either ablation of TRPV1-expressing nerves or TRPV1 antagonism increased adhesion. Defense against S. aureus adhesion did not depend on nerve firing. Despite having no significant impact on CD11c+ or Lyz2+ cell numbers, S. aureus challenge increased CD45+ cell counts, also dependent on TRPV1-expressing nerves, and it increased Lyz2+ cell sphericity and volume. Conclusion: Healthy corneas utilize TRPV1 to protect against S. aureus adhesion independently of sensory nerve firing. This contrasts with defense against P. aeruginosa adhesion which requires TRPA1 and nerve firing. How the differential immune cell responses to these two pathogens relate to TRP-dependent defense against adhesion remains to be determined.
-
Immunology and Microbiology
-
Neuroscience
IQGAP2 regulates blood-brain barrier immune dynamics.
In IScience on 21 March 2025 by Katdare, K. A., Kjar, A., et al.
Brain endothelial cells (BECs) play an important role in maintaining central nervous system (CNS) homeostasis through blood-brain barrier (BBB) functions. BECs express low baseline levels of adhesion receptors, which limits entry of leukocytes. However, the molecular mediators governing this phenotype remain mostly unclear. Here, we explored how infiltration of immune cells across the BBB is influenced by the scaffold protein IQ motif containing GTPase-activating protein 2 (IQGAP2). In mice and zebrafish, we demonstrate that loss of Iqgap2 increases infiltration of peripheral leukocytes into the CNS under homeostatic and inflammatory conditions. Using single-cell RNA sequencing and immunohistology, we further show that BECs from mice lacking Iqgap2 exhibit a profound inflammatory signature, including extensive upregulation of adhesion receptors and antigen-processing machinery. Human tissue analyses also reveal that Alzheimer's disease is associated with reduced hippocampal IQGAP2. Overall, our results implicate IQGAP2 as an essential regulator of BBB immune privilege and immune cell entry into the CNS.
© 2025 The Author(s).
-
Cardiovascular biology
-
Immunology and Microbiology
Preprint on BioRxiv : the Preprint Server for Biology on 17 March 2025 by Sorets, A. G., Schwensen, K. R., et al.
ABSTRACT Barriers of the central nervous system (CNS), such as the blood-brain barrier (BBB) and blood-cerebrospinal fluid barrier (BCSFB), regulate the two-way exchange of material between the blood and CNS. These barriers pose a considerable challenge for efficacious delivery of intravenously administered therapies into the CNS, motivating exploration of their function and ways to modulate their properties. While the BBB and BCSFB can become dysfunctional in patients with chronic CNS diseases, few studies have focused on strategies for targeting these interfaces. Here, we showed that an intravenously administered albumin-binding lipid-siRNA conjugate was delivered to and silences genes within brain endothelial cells and choroid plexus epithelial cells, which comprise the BBB and BCSFB, respectively. A single intravenous dose of lipid-siRNA conjugate was delivered to ∼100% of brain endothelial cells and major choroid plexus cell types, without any substantial delivery into brain parenchymal tissue. Sustained gene silencing was achieved in both brain endothelial cells (over two weeks) and bulk choroid plexus tissues (up to one month). Moreover, single cell RNA sequencing demonstrated gene knockdown in capillaries, venous endothelial cells, and choroid plexus epithelial cells without silencing genes in parenchymal cell populations. Collectively, this work establishes an effective nonviral framework to mediate gene inhibition in the brain barriers. GRAPHICAL ABSTRACT
-
IHC
-
Cardiovascular biology
-
Genetics
Dysfunctional β-cell autophagy induces β-cell stress and enhances islet immunogenicity.
In Frontiers in Immunology on 13 February 2025 by Austin, M. C., Muralidharan, C., et al.
Type 1 Diabetes (T1D) is caused by a combination of genetic and environmental factors that trigger autoimmune-mediated destruction of pancreatic β-cells. Defects in β-cell stress response pathways such as autophagy may play an important role in activating and/or exacerbating the immune response in disease development. Previously, we discovered that β-cell autophagy is impaired prior to the onset of T1D, implicating this pathway in T1D pathogenesis.
To assess the role of autophagy in β-cell health and survival, and whether defects in autophagy render islets more immunogenic.
We knocked out the critical autophagy enzyme, ATG7, in the β-cells of mice (ATG7Δβ-cell) then monitored blood glucose, performed glucose tolerance tests, and evaluated bulk islet mRNA and protein. We also assessed MHC-I expression and presence of CD45+ immune cells in ATG7Δβ-cell islets and evaluated how impaired autophagy affects EndoC-βH1 HLA-I expression under basal and IFNα stimulated conditions. Lastly, we co-cultured ATG7Δβ-cell islet cells with diabetogenic BDC2.5 helper T cells and evaluated T cell activation.
We found that all ATG7Δβ-cell mice developed diabetes between 11-15 weeks of age. Gene ontology analysis revealed a significant upregulation of pathways involved in inflammatory processes, response to ER stress, and the ER-associated degradation pathway. Interestingly, we also observed upregulation of proteins involved in MHC-I presentation, suggesting that defective β-cell autophagy may alter the immunopeptidome, or antigen repertoire, and enhance β-cell immune visibility. In support of this hypothesis, we observed increased MHC-I expression and CD45+ immune cells in ATG7Δβ-cell islets. We also demonstrate that HLA-I is upregulated in EndoC β-cells when autophagic degradation is inhibited. This effect was observed under both basal and IFNα stimulated conditions. Conversely, a stimulator of lysosome acidification/function, C381, decreased HLA-I expression. Lastly, we showed that in the presence of islet cells with defective autophagy, there is enhanced BDC2.5 T cell activation.
Our findings demonstrate that β-cell autophagy is critical to cell survival/function. Defective β-cell autophagy induces ER stress, alters pathways of antigen production, and enhances MHC-I/HLA-I presentation to surveilling immune cells. Overall, our results suggest that defects in autophagy make β-cells more susceptible to immune attack and destruction.
Copyright © 2025 Austin, Muralidharan, Roy, Crowder, Piganelli and Linnemann.
-
Mus musculus (House mouse)
-
Cell Biology
-
Immunology and Microbiology
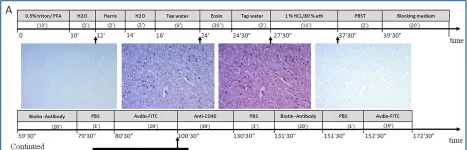
In PLoS One on 4 May 2023 by Li, Z., Muench, G., et al.
Fig.5.A

-
IHC
-
Mus musculus (House mouse)
Collected and cropped from PLoS One by CiteAb, provided under a CC-BY license
Image 1 of 10
In Nat Commun on 9 October 2019 by Liu, C., Tate, T., et al.
Fig.10.A

-
IHC-IF
-
Collected and cropped from Nat Commun by CiteAb, provided under a CC-BY license
Image 1 of 10
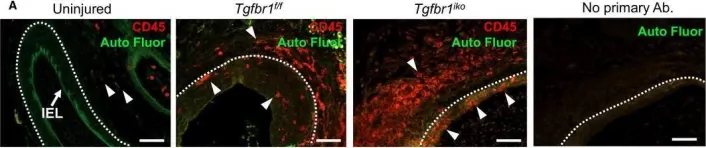
In Elife on 16 January 2019 by Gerber, D., Ghidinelli, M., et al.
Fig.3.C

-
ICC
-
Mus musculus (House mouse)
Collected and cropped from Elife by CiteAb, provided under a CC-BY license
Image 1 of 10
In Elife on 16 January 2019 by Gerber, D., Ghidinelli, M., et al.
Fig.3.D

-
ICC
-
Mus musculus (House mouse)
Collected and cropped from Elife by CiteAb, provided under a CC-BY license
Image 1 of 10
In Physiol Rep on 1 December 2016 by Liao, M., Yang, P., et al.
Fig.6.A

-
IHC-IF
-
Collected and cropped from Physiol Rep by CiteAb, provided under a CC-BY license
Image 1 of 10
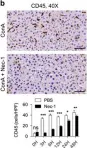
In Cell Death Dis on 7 May 2015 by Deutsch, M., Graffeo, C. S., et al.
Fig.5.B

-
IHC-P
-
Mus musculus (House mouse)
Collected and cropped from Cell Death Dis by CiteAb, provided under a CC-BY license
Image 1 of 10
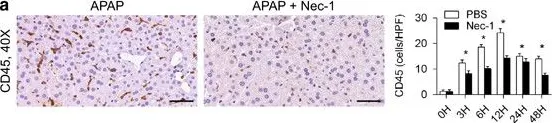
In Cell Death Dis on 7 May 2015 by Deutsch, M., Graffeo, C. S., et al.
Fig.7.A

-
IHC-P
-
Mus musculus (House mouse)
Collected and cropped from Cell Death Dis by CiteAb, provided under a CC-BY license
Image 1 of 10
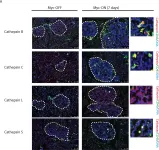
In PLoS One on 1 May 2015 by Brindle, N. R., Joyce, J. A., et al.
Fig.2.A

-
IHC
-
Mus musculus (House mouse)
Collected and cropped from PLoS One by CiteAb, provided under a CC-BY license
Image 1 of 10
In Front Cell Dev Biol on 5 November 2014 by Kimura, Y., Komaki, M., et al.
Fig.3.A

-
IHC
-
Mus musculus (House mouse)
Collected and cropped from Front Cell Dev Biol by CiteAb, provided under a CC-BY license
Image 1 of 10
In J Transl Med on 17 May 2011 by Delfín, D. A., Xu, Y., et al.
Fig.6.D

-
IHC-IF
-
Mus musculus (House mouse)
Collected and cropped from J Transl Med by CiteAb, provided under a CC-BY license
Image 1 of 10