The vastly spreading COVID-19 pneumonia is caused by SARS-CoV-2. Lymphopenia and cytokine levels are tightly associated with disease severity. However, virus-induced immune dysregulation at cellular and molecular levels remains largely undefined. Here, the leukocytes in the pleural effusion, sputum, and peripheral blood biopsies from severe and mild patients were analyzed at single-cell resolution. Drastic T cell hyperactivation accompanying elevated T cell exhaustion was observed, predominantly in pleural effusion. The mechanistic investigation identified a group of CD14+ monocytes and macrophages highly expressing CD163 and MRC1 in the biopsies from severe patients, suggesting M2 macrophage polarization. These M2-like cells exhibited up-regulated IL10, CCL18, APOE, CSF1 (M-CSF), and CCL2 signaling pathways. Further, cell type specific dysregulation of transposable elements was observed in Severe COVID-19 patients. Together, our results suggest that severe SARS-CoV-2 infection causes immune dysregulation by inducing M2 polarization and subsequent T cell exhaustion. This study improves our understanding of COVID-19 pathogenesis.
© 2024 The Authors. Published by Elsevier Ltd.
Product Citations: 29
In Heliyon on 15 October 2024 by Zhu, A., Zhou, L., et al.
-
COVID-19
-
Immunology and Microbiology
Tailoring Tfh profiles enhances antibody persistence to a clade C HIV-1 vaccine in rhesus macaques.
In eLife on 22 February 2024 by Verma, A., Hawes, C. E., et al.
CD4 T follicular helper cells (Tfh) are essential for establishing serological memory and have distinct helper attributes that impact both the quantity and quality of the antibody response. Insights into Tfh subsets that promote antibody persistence and functional capacity can critically inform vaccine design. Based on the Tfh profiles evoked by the live attenuated measles virus vaccine, renowned for its ability to establish durable humoral immunity, we investigated the potential of a Tfh1/17 recall response during the boost phase to enhance persistence of HIV-1 Envelope (Env) antibodies in rhesus macaques. Using a DNA-prime encoding gp160 antigen and Tfh polarizing cytokines (interferon protein-10 (IP-10) and interleukin-6 (IL-6)), followed by a gp140 protein boost formulated in a cationic liposome-based adjuvant (CAF01), we successfully generated germinal center (GC) Tfh1/17 cells. In contrast, a similar DNA-prime (including IP-10) followed by gp140 formulated with monophosphoryl lipid A (MPLA) +QS-21 adjuvant predominantly induced GC Tfh1 cells. While the generation of GC Tfh1/17 cells with CAF01 and GC Tfh1 cells with MPLA +QS-21 induced comparable peak Env antibodies, the latter group demonstrated significantly greater antibody concentrations at week 8 after final immunization which persisted up to 30 weeks (gp140 IgG ng/ml- MPLA; 5500; CAF01, 2155; p<0.05). Notably, interferon γ+Env-specific Tfh responses were consistently higher with gp140 in MPLA +QS-21 and positively correlated with Env antibody persistence. These findings suggest that vaccine platforms maximizing GC Tfh1 induction promote persistent Env antibodies, important for protective immunity against HIV.
© 2023, Verma, Hawes et al.
-
Immunology and Microbiology
In The Journal of Immunology on 1 October 2023 by Miller, D., Romero, R., et al.
T cells are implicated in the pathophysiology of preterm labor and birth, the leading cause of neonatal morbidity and mortality worldwide. Specifically, maternal decidual T cells infiltrate the chorioamniotic membranes in chronic chorioamnionitis (CCA), a placental lesion considered to reflect maternal anti-fetal rejection, leading to preterm labor and birth. However, the phenotype and TCR repertoire of decidual T cells in women with preterm labor and CCA have not been investigated. In this study, we used phenotyping, TCR sequencing, and functional assays to elucidate the molecular characteristics and Ag specificity of T cells infiltrating the chorioamniotic membranes in women with CCA who underwent term or preterm labor. Phenotyping indicated distinct enrichment of human decidual effector memory T cell subsets in cases of preterm labor with CCA without altered regulatory T cell proportions. TCR sequencing revealed that the T cell repertoire of CCA is characterized by increased TCR richness and decreased clonal expansion in women with preterm labor. We identified 15 clones associated with CCA and compared these against established TCR databases, reporting that infiltrating T cells may possess specificity for maternal and fetal Ags, but not common viral Ags. Functional assays demonstrated that choriodecidual T cells can respond to maternal and fetal Ags. Collectively, our findings provide, to our knowledge, novel insight into the complex processes underlying chronic placental inflammation and further support a role for effector T cells in the mechanisms of disease for preterm labor and birth. Moreover, this work further strengthens the contribution of adaptive immunity to the syndromic nature of preterm labor and birth.
Copyright © 2023 by The American Association of Immunologists, Inc.
-
Homo sapiens (Human)
-
Immunology and Microbiology
In Cell Reports Medicine on 18 April 2023 by Nguyen, T. H. O., Rowntree, L. C., et al.
Immunocompromised hematology patients are vulnerable to severe COVID-19 and respond poorly to vaccination. Relative deficits in immunity are, however, unclear, especially after 3 vaccine doses. We evaluated immune responses in hematology patients across three COVID-19 vaccination doses. Seropositivity was low after a first dose of BNT162b2 and ChAdOx1 (∼26%), increased to 59%-75% after a second dose, and increased to 85% after a third dose. While prototypical antibody-secreting cells (ASCs) and T follicular helper (Tfh) cell responses were elicited in healthy participants, hematology patients showed prolonged ASCs and skewed Tfh2/17 responses. Importantly, vaccine-induced expansions of spike-specific and peptide-HLA tetramer-specific CD4+/CD8+ T cells, together with their T cell receptor (TCR) repertoires, were robust in hematology patients, irrespective of B cell numbers, and comparable to healthy participants. Vaccinated patients with breakthrough infections developed higher antibody responses, while T cell responses were comparable to healthy groups. COVID-19 vaccination induces robust T cell immunity in hematology patients of varying diseases and treatments irrespective of B cell numbers and antibody response.
Copyright © 2023 The Author(s). Published by Elsevier Inc. All rights reserved.
-
COVID-19
-
Immunology and Microbiology
Reduced blood-stage malaria growth and immune correlates in humans following RH5 vaccination.
In Med (New York, N.Y.) on 11 June 2021 by Minassian, A. M., Silk, S. E., et al.
Development of an effective vaccine against the pathogenic blood-stage infection of human malaria has proved challenging, and no candidate vaccine has affected blood-stage parasitemia following controlled human malaria infection (CHMI) with blood-stage Plasmodium falciparum.We undertook a phase I/IIa clinical trial in healthy adults in the United Kingdom of the RH5.1 recombinant protein vaccine, targeting the P. falciparum reticulocyte-binding protein homolog 5 (RH5), formulated in AS01B adjuvant. We assessed safety, immunogenicity, and efficacy against blood-stage CHMI. Trial registered at ClinicalTrials.gov, NCT02927145.The RH5.1/AS01B formulation was administered using a range of RH5.1 protein vaccine doses (2, 10, and 50 μg) and was found to be safe and well tolerated. A regimen using a delayed and fractional third dose, in contrast to three doses given at monthly intervals, led to significantly improved antibody response longevity over ∼2 years of follow-up. Following primary and secondary CHMI of vaccinees with blood-stage P. falciparum, a significant reduction in parasite growth rate was observed, defining a milestone for the blood-stage malaria vaccine field. We show that growth inhibition activity measured in vitro using purified immunoglobulin G (IgG) antibody strongly correlates with in vivo reduction of the parasite growth rate and also identify other antibody feature sets by systems serology, including the plasma anti-RH5 IgA1 response, that are associated with challenge outcome.Our data provide a new framework to guide rational design and delivery of next-generation vaccines to protect against malaria disease.This study was supported by USAID, UK MRC, Wellcome Trust, NIAID, and the NIHR Oxford-BRC.© 2021 The Author(s).
-
FC/FACS
-
Cardiovascular biology
-
Immunology and Microbiology
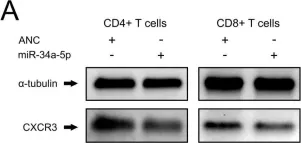
In J Immunother Cancer on 1 November 2020 by Hart, M., Nickl, L., et al.
Fig.5.A

-
WB
-
Collected and cropped from J Immunother Cancer by CiteAb, provided under a CC-BY license
Image 1 of 1