Cells secrete extracellular vesicles (EVs) and non-vesicular extracellular (nano)particles (NVEPs or ENPs) that may play a role in intercellular communication. Tumor-derived EVs have been proposed to induce immune priming of antigen presenting cells or to be immuno-suppressive agents. We suspect that such disparate functions are due to variable compositions in EV subtypes and ENPs. We aimed to characterize the array of secreted EVs and ENPs of murine tumor cell lines. Unexpectedly, we identified virus-like particles (VLPs) from endogenous murine leukemia virus in preparations of EVs produced by many tumor cells. We established a protocol to separate small EVs from VLPs and ENPs. We compared their protein composition and analyzed their functional interaction with target dendritic cells. ENPs were poorly captured and did not affect dendritic cells. Small EVs specifically induced dendritic cell death. A mixed large/dense EV/VLP preparation was most efficient to induce dendritic cell maturation and antigen presentation. Our results call for systematic re-evaluation of the respective proportions and functions of non-viral EVs and VLPs produced by murine tumors and their contribution to tumor progression.
© 2023 The Authors. Published under the terms of the CC BY NC ND 4.0 license.
Product Citations: 47
In The EMBO Journal on 11 December 2023 by Cocozza, F., Martin-Jaular, L., et al.
-
Mus musculus (House mouse)
-
Cancer Research
-
Immunology and Microbiology
Extracellular vesicles and co-isolated endogenous retroviruses differently affect dendritic cells
Preprint on BioRxiv : the Preprint Server for Biology on 28 January 2023 by Cocozza, F., Martin-Jaular, L., et al.
ABSTRACT Cells secrete membrane-enclosed extracellular vesicles (EVs) and non-vesicular nanoparticles (ENPs) that may play a role in intercellular communication. Tumor-derived EVs have been proposed either to induce immune priming of antigen presenting cells, or, to be immuno-suppressive agents promoting tumor immune escape. We suspect that such disparate functions are due to variable composition in EV subtypes and ENPs of the analyzed EV preparations. We aimed to exhaustively characterize the array of secreted EVs and ENPs of murine tumor cell lines. Unexpectedly, we identified virus-like particles (VLPs) from endogenous murine leukemia virus in preparations of EVs produced by tumor cells. We established a robust protocol to separate small (s)EVs from VLPs and ENPs. We compared their protein composition and analyzed their functional interaction with target dendritic cells (DCs). ENPs were poorly captured and did not affect DCs. sEVs specifically induced DC death. A mixed EV/VLP preparation was the most efficient to induce DC maturation and antigen presentation. Our results call for systematic re-evaluation of the respective proportions and functions of non-viral EVs and VLPs produced by tumors and their contribution to anti-tumor immune responses and to tumor progression.
-
Mus musculus (House mouse)
-
Immunology and Microbiology
In Materials Today. Bio on 15 December 2022 by Wu, Y. W., Wang, W. Y., et al.
Most existing vaccines use activators that polarize the immune response to T-helper (Th) 2 response for antibody production. Our positively charged chitosan (Cs)-based nanocomplex (CNC) drives the Th1 response through unknown mechanisms. As receptors for the positively charged CNC are not determined, the physico-chemical properties are hypothesized to correlate with its immunomodulatory effects. To clarify the effects of surface charge and size on the immune response, smaller CNC and negatively charged CNC encapsulating ovalbumin are tested on dendritic cell (DC) 2.4 cells. The negatively charged CNC loses activity, but the smaller CNC does not. To further evaluate the material effects, we replace Cs by poly-amino acids. Compared with the negatively charged nanocomplex, the positively charged one preserves its activity. Using immature bone marrow-derived DCs (BMDC) enriched from BALB/c mice as a model to analyze DC differentiation, treatments with positively charged nanocomplexes evidently increase the proportions of Langerin+ dermal DC, CD11blo interstitial DC, and CD8a+ conventional DC. Additionally, vaccination with two doses containing positively charged nanocomplexes are safe and increase ovalbumin-specific IgG and recall T-cell responses in mice. Overall, a positive charge seems to contribute to the immunological effect of nanocomplexes on elevating the Th1 response by modulating DC differentiation.
© 2022 The Authors.
-
FC/FACS
-
Mus musculus (House mouse)
-
Immunology and Microbiology
In Cell Reports on 16 August 2022 by Gros, M., Segura, E., et al.
Despite its crucial role in initiation of cytotoxic immune responses, the molecular pathways underlying antigen cross-presentation remain incompletely understood. The mechanism of antigen exit from endocytic compartments into the cytosol is a long-standing matter of controversy, confronting two main models: transfer through specific channels/transporters or rupture of endocytic membranes and leakage of luminal content. By monitoring the occurrence of intracellular damage in conventional dendritic cells (cDCs), we show that cross-presenting cDC1s display more frequent endomembrane injuries and increased recruitment of endosomal sorting complex required for transport (ESCRT)-III, the main repair system for intracellular membranes, relative to cDC2s. Silencing of CHMP2a or CHMP4b, two effector subunits of ESCRT-III, enhances cytosolic antigen export and cross-presentation. This phenotype is partially reversed by chemical inhibition of RIPK3, suggesting that endocytic damage is related to basal activation of the necroptosis pathway. Membrane repair therefore proves crucial in containing antigen export to the cytosol and cross-presentation in cDCs.
Copyright © 2022 The Author(s). Published by Elsevier Inc. All rights reserved.
-
FC/FACS
-
Mus musculus (House mouse)
-
Cell Biology
-
Immunology and Microbiology
Mobilization-based chemotherapy-free engraftment of gene-edited human hematopoietic stem cells.
In Cell on 23 June 2022 by Omer-Javed, A., Pedrazzani, G., et al.
Hematopoietic stem/progenitor cell gene therapy (HSPC-GT) is proving successful to treat several genetic diseases. HSPCs are mobilized, harvested, genetically corrected ex vivo, and infused, after the administration of toxic myeloablative conditioning to deplete the bone marrow (BM) for the modified cells. We show that mobilizers create an opportunity for seamless engraftment of exogenous cells, which effectively outcompete those mobilized, to repopulate the depleted BM. The competitive advantage results from the rescue during ex vivo culture of a detrimental impact of mobilization on HSPCs and can be further enhanced by the transient overexpression of engraftment effectors exploiting optimized mRNA-based delivery. We show the therapeutic efficacy in a mouse model of hyper IgM syndrome and further developed it in human hematochimeric mice, showing its applicability and versatility when coupled with gene transfer and editing strategies. Overall, our findings provide a potentially valuable strategy paving the way to broader and safer use of HSPC-GT.Copyright © 2022 The Authors. Published by Elsevier Inc. All rights reserved.
-
FC/FACS
-
Mus musculus (House mouse)
-
Stem Cells and Developmental Biology
In F1000Res on 24 July 2014 by Niebling, J., E Rünker, A., et al.
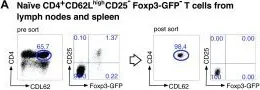
Fig.2.A

-
FC/FACS
-
Mus musculus (House mouse)
Collected and cropped from F1000Res by CiteAb, provided under a CC-BY license
Image 1 of 1