Extracellular vesicles (EVs), including small EVs (sEVs) such as exosomes, play crucial roles in intercellular communication and disease pathology. Their heterogeneous nature, shaped by cellular origin and activation state, requires precise and multiplexed profiling of surface markers for effective characterization. Despite recent advances, current analytical methods remain complex, costly, or inaccessible for routine laboratory use. Here, we present a simple and cost-effective flow cytometry-based assay for the multiplexed analysis of tetraspanin markers (CD63, CD81, CD9) on fluorescently labeled sEVs. Our method combines metabolic labeling with paraformaldehyde fixation and low-speed centrifugation using a benchtop centrifuge, enabling efficient removal of unbound antibodies and minimizing nonspecific signals while preserving vesicle integrity. Using either metabolically labeled exosomes or bulk sEVs stained with carboxyfluorescein succinimidyl ester (CFSE), we demonstrate robust recovery and accurate, semi-quantitative profiling of tetraspanin expression. The assay reveals substantial variability in tetraspanin distribution across different cell lines and does not require ultracentrifugation or immunocapture. Notably, this versatile and reproducible method supports high sEV recovery and is adaptable to additional protein markers. Its compatibility with standard laboratory equipment makes it a practical and scalable alternative to more complex techniques, expanding access to multiplex sEV analysis for both research and clinical applications.
Product Citations: 29
In Cells on 28 June 2025 by Polignano, D., Barreca, V., et al.
-
Cell Biology
Human tetraspanin CD81 facilitates invasion of Salmonella enterica into human epithelial cells.
In Virulence on 1 December 2024 by Alvarez, K. G., Goral, L., et al.
Human CD81 and CD9 are members of the tetraspanin family of proteins characterized by a canonical structure of four transmembrane domains and two extracellular loop domains. Tetraspanins are known as molecular facilitators, which assemble and organize cell surface receptors and partner molecules forming clusters known as tetraspanin-enriched microdomains. They have been implicated to play various biological roles including an involvement in infections with microbial pathogens. Here, we demonstrate an important role of CD81 for the invasion of epithelial cells by Salmonella enterica. We show that the overexpression of CD81 in HepG2 cells enhances invasion of various typhoidal and non-typhoidal Salmonella serovars. Deletion of CD81 by CRISPR/Cas9 in intestinal epithelial cells (C2BBe1 and HT29-MTX-E12) reduces S. Typhimurium invasion. In addition, the effect of human CD81 is species-specific as only human but not rat CD81 facilitates Salmonella invasion. Finally, immunofluorescence microscopy and proximity ligation assay revealed that both human tetraspanins CD81 and CD9 are recruited to the entry site of S. Typhimurium during invasion but not during adhesion to the host cell surface. Overall, we demonstrate that the human tetraspanin CD81 facilitates Salmonella invasion into epithelial host cells.
Site-specific DNA insertion into the human genome with engineered recombinases
Preprint on BioRxiv : the Preprint Server for Biology on 3 November 2024 by Fanton, A., Bartie, L. J., et al.
Technologies for precisely inserting large DNA sequences into the genome are critical for diverse research and therapeutic applications. Large serine recombinases (LSRs) can mediate direct, site-specific genomic integration of multi-kilobase DNA sequences without a pre-installed landing pad, but current approaches suffer from low insertion rates and high off-target activity. Here, we present a comprehensive engineering roadmap for the joint optimization of DNA recombination efficiency and specificity. We combined directed evolution, structural analysis, and computational models to rapidly identify additive mutational combinations. We further enhanced performance through donor DNA optimization and dCas9 fusions, enabling simultaneous target and donor recruitment. Top engineered LSR variants achieved up to 53% integration efficiency and 97% genome-wide specificity at an endogenous human locus, and effectively integrated large DNA cargoes (up to 12 kb tested) for stable expression in challenging cell types, including non-dividing cells, human embryonic stem cells, and primary human T cells. This blueprint for rational engineering of DNA recombinases enables precise genome engineering without the generation of double-stranded breaks.
-
Genetics
In Nature Communications on 19 June 2024 by Shender, V., Anufrieva, K. S., et al.
Ovarian cancer often develops resistance to conventional therapies, hampering their effectiveness. Here, using ex vivo paired ovarian cancer ascites obtained before and after chemotherapy and in vitro therapy-induced secretomes, we show that molecules secreted by ovarian cancer cells upon therapy promote cisplatin resistance and enhance DNA damage repair in recipient cancer cells. Even a short-term incubation of chemonaive ovarian cancer cells with therapy-induced secretomes induces changes resembling those that are observed in chemoresistant patient-derived tumor cells after long-term therapy. Using integrative omics techniques, we find that both ex vivo and in vitro therapy-induced secretomes are enriched with spliceosomal components, which relocalize from the nucleus to the cytoplasm and subsequently into the extracellular vesicles upon treatment. We demonstrate that these molecules substantially contribute to the phenotypic effects of therapy-induced secretomes. Thus, SNU13 and SYNCRIP spliceosomal proteins promote therapy resistance, while the exogenous U12 and U6atac snRNAs stimulate tumor growth. These findings demonstrate the significance of spliceosomal network perturbation during therapy and further highlight that extracellular signaling might be a key factor contributing to the emergence of ovarian cancer therapy resistance.
© 2024. The Author(s).
-
Cancer Research
In EJHaem on 1 April 2024 by Gong, X., Hu, T., et al.
ETV6::RUNX1 is the most common fusion gene in childhood acute lymphoblastic leukaemia (ALL) and is associated with favorable outcomes, especially in low-risk children. However, as many as 10% of children relapse within 3 years, and such early relapses have poor survival. Identifying children at risk for early relapse is an important challenge. We interrogated data from 87 children with low-risk ETV6::RUNX1-positive B-cell ALL and with available preserved bone marrow samples (discovery cohort). We profiled somatic point mutations in a panel of 559 genes and genome-wide transcriptome and single-nucleotide variants. We found high TIMD4 expression (> 85th-percentile value) at diagnosis was the most important independent prognostic factor of early relapse (hazard ratio [HR] = 5.07 [1.76, 14.62]; p = 0.03). In an independent validation cohort of low-risk ETV6::RUNX1-positive B-cell ALL (N = 68) high TIMD4 expression at diagnosis had an HR = 4.78 [1.07, 21.36] (p = 0.04) for early relapse. In another validation cohort including 78 children with low-risk ETV6::RUNX1-negative B-cell ALL, high TIMD4 expression at diagnosis had an HR = 3.93 [1.31, 11.79] (p = 0.01). Our results suggest high TIMD4 expression at diagnosis in low-risk B-cell ALL in children might be associated with high risk for early relapse.
© 2024 The Authors. eJHaem published by British Society for Haematology and John Wiley & Sons Ltd.
-
Immunology and Microbiology
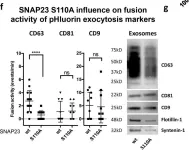
In J Cell Biol on 5 March 2018 by Verweij, F. J., Bebelman, M. P., et al.
Fig.6.F

-
WB
-
Homo sapiens (Human)
Collected and cropped from J Cell Biol by CiteAb, provided under a CC-BY license
Image 1 of 2
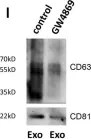
In J Cell Biol on 5 March 2018 by Verweij, F. J., Bebelman, M. P., et al.
Fig.1.L

-
WB
-
Homo sapiens (Human)
Collected and cropped from J Cell Biol by CiteAb, provided under a CC-BY license
Image 1 of 2