Members of the Vesiculovirus genus including Jurona virus (JURV) have emerged as promising immunotherapeutic agents, characterized by their tumor selectivity, fast kinetics, low seroprevalence, and minimal toxicity in humans. Here, we demonstrate that the administration of JURV leads to tumor regression in both hepatocellular carcinoma (HCC) xenograft and syngeneic models. Furthermore, our findings indicate that combining JURV and anti-PD-1 therapy reduced tumor burden and improved survival rates over JURV or anti-PD-1 alone in an orthotopic HCC model. Proteogenomic analysis of JURV-treated, murine HCC tumors demonstrates that the therapeutic effects of the combination of JURV and anti-PD-1 are predominantly driven by coordinated activation of immune effectors, which modulate the tumor microenvironment into a state conducive to anti-tumor activity. Our results establish JURV as a potent candidate for immunovirotherapy in HCC, capable of modulating immune response and synergizing with standard of care for HCC to prolong survival in preclinical models. Further, this research deepens our understanding of JURV's anti-tumoral mechanisms and highlights its potential as a novel approach to HCC treatment strategies.
© 2024 The Author(s).
Product Citations: 52
In Molecular Therapy. Oncology on 19 December 2024 by Tesfay, M. Z., Zhang, Y., et al.
-
FC/FACS
-
Mus musculus (House mouse)
-
Cancer Research
-
Immunology and Microbiology
CXCR4 orchestrates the TOX-programmed exhausted phenotype of CD8+ T cells via JAK2/STAT3 pathway.
In Cell Genom on 9 October 2024 by Cao, C., Xu, M., et al.
Evidence from clinical trials suggests that CXCR4 antagonists enhance immunotherapy effectiveness in several cancers. However, the specific mechanisms through which CXCR4 contributes to immune cell phenotypes are not fully understood. Here, we employed single-cell transcriptomic analysis and identified CXCR4 as a marker gene in T cells, with CD8+PD-1high exhausted T (Tex) cells exhibiting high CXCR4 expression. By blocking CXCR4, the Tex phenotype was attenuated in vivo. Mechanistically, CXCR4-blocking T cells mitigated the Tex phenotype by regulating the JAK2-STAT3 pathway. Single-cell RNA/TCR/ATAC-seq confirmed that Cxcr4-deficient CD8+ T cells epigenetically mitigated the transition from functional to exhausted phenotypes. Notably, clinical sample analysis revealed that CXCR4+CD8+ T cells showed higher expression in patients with a non-complete pathological response. Collectively, these findings demonstrate the mechanism by which CXCR4 orchestrates CD8+ Tex cells and provide a rationale for combining CXCR4 antagonists with immunotherapy in clinical trials.
Copyright © 2024 The Author(s). Published by Elsevier Inc. All rights reserved.
-
Immunology and Microbiology
In Communications Biology on 23 May 2024 by Kanno, T., Konno, R., et al.
Recent studies have highlighted the significance of cellular metabolism in the initiation of clonal expansion and effector differentiation of T cells. Upon exposure to antigens, naïve CD4+ T cells undergo metabolic reprogramming to meet their metabolic requirements. However, only few studies have simultaneously evaluated the changes in protein and metabolite levels during T cell differentiation. Our research seeks to fill the gap by conducting a comprehensive analysis of changes in levels of metabolites, including sugars, amino acids, intermediates of the TCA cycle, fatty acids, and lipids. By integrating metabolomics and proteomics data, we discovered that the quantity and composition of cellular lipids underwent significant changes in different effector Th cell subsets. Especially, we found that the sphingolipid biosynthesis pathway was commonly activated in Th1, Th2, Th17, and iTreg cells and that inhibition of this pathway led to the suppression of Th17 and iTreg cells differentiation. Additionally, we discovered that Th17 and iTreg cells enhance glycosphingolipid metabolism, and inhibition of this pathway also results in the suppression of Th17 and iTreg cell generation. These findings demonstrate that the utility of our combined metabolomics and proteomics analysis in furthering the understanding of metabolic transition during Th cell differentiation.
© 2024. The Author(s).
-
FC/FACS
-
Mus musculus (House mouse)
-
Biochemistry and Molecular biology
-
Cell Biology
-
Immunology and Microbiology
In Cell Reports Medicine on 17 October 2023 by Dan, J., Cai, J., et al.
Although promising, dendritic cell (DC) vaccines still provide limited clinical benefits, mainly due to the immunosuppressive tumor microenvironment (TME) and the lack of tumor-associated antigens (TAAs). Oncolytic virus therapy is an ideal strategy to overcome immunosuppression and expose TAAs; therefore, they may work synergistically with DC vaccines. In this study, we demonstrate that oncolytic virus M1 (OVM) can enhance the antitumor effects of DC vaccines across diverse syngeneic mouse tumor models by increasing the infiltration of CD8+ effector T cells in the TME. Mechanically, we show that tumor cells counteract DC vaccines through the SIRPα-CD47 immune checkpoint, while OVM can downregulate SIRPα in DCs and CD47 in tumor cells. Since OVM upregulates PD-L1 in DCs, combining PD-L1 blockade with DC vaccines and OVM further enhances antitumor activity. Overall, OVM strengthens the antitumor efficacy of DC vaccines by targeting the SIRPα-CD47 axis, which exerts dominant immunosuppressive effects on DC vaccines.
Copyright © 2023 The Author(s). Published by Elsevier Inc. All rights reserved.
-
Immunology and Microbiology
ERK and USP5 govern PD-1 homeostasis via deubiquitination to modulate tumor immunotherapy.
In Nature Communications on 19 May 2023 by Xiao, X., Shi, J., et al.
The programmed cell death protein 1 (PD-1) is an inhibitory receptor on T cells and plays an important role in promoting cancer immune evasion. While ubiquitin E3 ligases regulating PD-1 stability have been reported, deubiquitinases governing PD-1 homeostasis to modulate tumor immunotherapy remain unknown. Here, we identify the ubiquitin-specific protease 5 (USP5) as a bona fide deubiquitinase for PD-1. Mechanistically, USP5 interacts with PD-1, leading to deubiquitination and stabilization of PD-1. Moreover, extracellular signal-regulated kinase (ERK) phosphorylates PD-1 at Thr234 and promotes PD-1 interaction with USP5. Conditional knockout of Usp5 in T cells increases the production of effector cytokines and retards tumor growth in mice. USP5 inhibition in combination with Trametinib or anti-CTLA-4 has an additive effect on suppressing tumor growth in mice. Together, this study describes a molecular mechanism of ERK/USP5-mediated regulation of PD-1 and identifies potential combinatorial therapeutic strategies for enhancing anti-tumor efficacy.
© 2023. The Author(s).
-
FC/FACS
-
Mus musculus (House mouse)
-
Homo sapiens (Human)
-
Cancer Research
-
Immunology and Microbiology
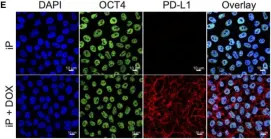
In Front Endocrinol (Lausanne) on 27 July 2021 by Castro-Gutierrez, R., Alkanani, A., et al.
Fig.2.E

-
ICC-IF
-
Homo sapiens (Human)
Collected and cropped from Front Endocrinol (Lausanne) by CiteAb, provided under a CC-BY license
Image 1 of 2
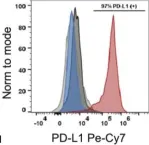
In Front Endocrinol (Lausanne) on 27 July 2021 by Castro-Gutierrez, R., Alkanani, A., et al.
Fig.2.F

-
FC/FACS
-
Homo sapiens (Human)
Collected and cropped from Front Endocrinol (Lausanne) by CiteAb, provided under a CC-BY license
Image 1 of 2