The pancreatic duct plays a key role in collecting pancreatic juice, which is rich in digestive enzymes. The fluid flows unidirectionally into the duodenum, where it mixes with partially digested food to further facilitate digestion. In this study, we report the generation of pancreatic ductal organoids from non-human primates for the first time, aimed at investigating the role of tuft cells that reside in the pancreatic duct since no studies have addressed the role of tuft cells in the pancreas. The organoids were maintained in a medium supplemented with Wnt3a, Noggin, R-spondin, and other factors that support pancreatic duct proliferation. These pancreatic organoids expressed the stem cell marker LGR5 mRNA and the ductal marker protein CK19, although tuft cell markers were not detectable at this stage. Upon stimulation with IL-4/13, tuft cell differentiation was confirmed by immunohistochemistry and transcriptomic analysis. We observed induction of DCLK1, as well as taste signaling molecules such as TRPM5 and PLCβ2, which are markers of type II taste cells. Additionally, upregulation of LYZ and DEFB1 mRNA indicated the expression of antimicrobial peptide markers, alongside molecules associated with inflammation. Furthermore, the differentiated organoids specifically responded to a bitter compound, suggesting that pancreatic tuft cells may play a role in detecting potentially harmful chemicals. Finally, immunohistochemical analysis identified tuft cells in the non-human primate pancreas, supporting their involvement in sensing harmful compounds and regulating protective responses within the pancreas.
Copyright © 2025 Sakaguchi, Kimura-Nakajima, Inaba, Hatano, Ogawa, Koshiishi, Tanaka, Kometani, Ohmoto, Sato, Imai and Iwatsuki.
Product Citations: 60
In Frontiers in Cell and Developmental Biology on 21 May 2025 by Sakaguchi, K., Kimura-Nakajima, C., et al.
-
IHC
-
Mus musculus (House mouse)
Mesenchyme instructs growth while epithelium directs branching in the mouse mammary gland.
In eLife on 5 March 2024 by Lan, Q., Trela, E., et al.
The mammary gland is a unique organ that undergoes dynamic alterations throughout a female's reproductive life, making it an ideal model for developmental, stem cell and cancer biology research. Mammary gland development begins in utero and proceeds via a quiescent bud stage before the initial outgrowth and subsequent branching morphogenesis. How mammary epithelial cells transit from quiescence to an actively proliferating and branching tissue during embryogenesis and, importantly, how the branch pattern is determined remain largely unknown. Here, we provide evidence indicating that epithelial cell proliferation and onset of branching are independent processes, yet partially coordinated by the Eda signaling pathway. Through heterotypic and heterochronic epithelial-mesenchymal recombination experiments between mouse mammary and salivary gland tissues and ex vivo live imaging, we demonstrate that unlike previously concluded, the mode of branching is an intrinsic property of the mammary epithelium whereas the pace of growth and the density of ductal tree are determined by the mesenchyme. Transcriptomic profiling and ex vivo and in vivo functional studies in mice disclose that mesenchymal Wnt/ß-catenin signaling, and in particular IGF-1 downstream of it critically regulate mammary gland growth. These results underscore the general need to carefully deconstruct the different developmental processes producing branched organs.
© 2024, Lan et al.
-
Mus musculus (House mouse)
In Cell Stem Cell on 7 December 2023 by Rizvi, F., Lee, Y. R., et al.
The liver is known for its remarkable regenerative ability through proliferation of hepatocytes. Yet, during chronic injury or severe hepatocyte death, proliferation of hepatocytes is exhausted. To overcome this hurdle, we propose vascular-endothelial-growth-factor A (VEGFA) as a therapeutic means to accelerate biliary epithelial-cell (BEC)-to-hepatocyte conversion. Investigation in zebrafish establishes that blocking VEGF receptors abrogates BEC-driven liver repair, while VEGFA overexpression promotes it. Delivery of VEGFA via nonintegrative and safe nucleoside-modified mRNA encapsulated into lipid nanoparticles (mRNA-LNPs) in acutely or chronically injured mouse livers induces robust BEC-to-hepatocyte conversion and elimination of steatosis and fibrosis. In human and murine diseased livers, we further identified VEGFA-receptor KDR-expressing BECs associated with KDR-expressing cell-derived hepatocytes. This work defines KDR-expressing cells, most likely being BECs, as facultative progenitors. This study reveals unexpected therapeutic benefits of VEGFA delivered via nucleoside-modified mRNA-LNP, whose safety is widely validated with COVID-19 vaccines, for harnessing BEC-driven repair to potentially treat liver diseases.
Copyright © 2023 The Authors. Published by Elsevier Inc. All rights reserved.
-
Mus musculus (House mouse)
-
Genetics
-
Stem Cells and Developmental Biology
Heterogeneous murine peribiliary glands orchestrate compartmentalized epithelial renewal.
In Developmental Cell on 4 December 2023 by Singh, S., Lian, Q., et al.
The extrahepatic branches of the biliary tree have glands that connect to the surface epithelium through narrow pits. The duct epithelia undergo homeostatic renewal, yet the identity and multiplicity of cells that maintain this tissue is unknown. Using marker-free and targeted clonal fate mapping in mice, we provide evidence that the extrahepatic bile duct is compartmentalized. Pit cholangiocytes of extramural glands renewed the surface epithelium, whereas basally oriented cholangiocytes maintained the gland itself. In contrast, basally positioned cholangiocytes replenished the surface epithelium in mural glands. Single-cell sequencing identified genes enriched in the base and surface epithelial populations, with trajectory analysis showing graded gene expression between these compartments. Epithelia were plastic, changing cellular identity upon fasting and refeeding. Gain of canonical Wnt signaling caused basal cell expansion, gastric chief cell marker expression, and a decrease in surface epithelial markers. Our results identify the cellular hierarchy governing extrahepatic biliary epithelial renewal.
Copyright © 2023 The Author(s). Published by Elsevier Inc. All rights reserved.
-
Stem Cells and Developmental Biology
In eLife on 17 October 2023 by Kaneko, K., Liang, Y., et al.
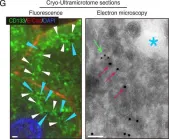
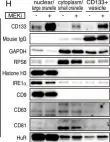
CD133 (prominin 1) is widely viewed as a cancer stem cell marker in association with drug resistance and cancer recurrence. Herein, we report that with impaired RTK-Shp2-Ras-Erk signaling, heterogenous hepatocytes form clusters that manage to divide during mouse liver regeneration. These hepatocytes are characterized by upregulated CD133 while negative for other progenitor cell markers. Pharmaceutical inhibition of proliferative signaling also induced CD133 expression in various cancer cell types from multiple animal species, suggesting an inherent and common mechanism of stress response. Super-resolution and electron microscopy localize CD133 on intracellular vesicles that apparently migrate between cells, which we name 'intercellsome.' Isolated CD133+ intercellsomes are enriched with mRNAs rather than miRNAs. Single-cell RNA sequencing reveals lower intracellular diversity (entropy) of mitogenic mRNAs in Shp2-deficient cells, which may be remedied by intercellular mRNA exchanges between CD133+ cells. CD133-deficient cells are more sensitive to proliferative signal inhibition in livers and intestinal organoids. These data suggest a mechanism of intercellular communication to compensate for intracellular signal deficit in various cell types.
© 2023, Kaneko et al.
-
IHC-IF
-
WB
-
Mus musculus (House mouse)
In Elife on 17 October 2023 by Kaneko, K., Liang, Y., et al.
Fig.5.G

-
IHC-IF
-
Mus musculus (House mouse)
Collected and cropped from Elife by CiteAb, provided under a CC-BY license
Image 1 of 3
In Elife on 17 October 2023 by Kaneko, K., Liang, Y., et al.
Fig.5.H

-
WB
-
Mus musculus (House mouse)
Collected and cropped from Elife by CiteAb, provided under a CC-BY license
Image 1 of 3
In Sci Rep on 29 January 2018 by Sarrach, S., Huang, Y., et al.
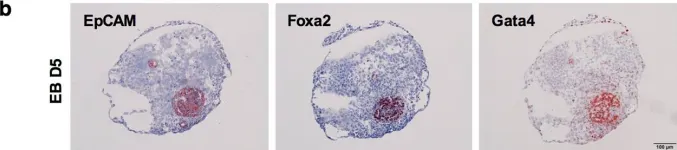
Fig.5.B

-
IHC
-
Mus musculus (House mouse)
Collected and cropped from Sci Rep by CiteAb, provided under a CC-BY license
Image 1 of 3