Detecting cytoplasmic or extracellular DNA from host or pathogen origin by DNA sensor cyclic GMP-AMP synthase (cGAS) and stimulator of interferon genes (STING) triggers immune responses with secretion of type I interferons and inflammatory cytokines. However, STING agonists function as type-2 adjuvant promoting allergic asthma. Here, we asked how cGAS/STING signaling pathway influences allergen-induced type-2 immune responses in models of allergic airway diseases induced by birch pollen extract, house dust mite, or ovalbumin plus Alum. We report increased extracellular dsDNA in the airways, together with cGAS and STING gene expression, following allergen challenge in these models, correlating dsDNA and type-2 cytokine IL-4, IL-5, and IL-13 release. Allergen-induced type-2 immune responses were reduced in cGAS- or STING-deficient mice. Further, blocking cGAS function with the specific inhibitor RU.521 protected mice from birch pollen allergen-induced airway inflammation and type-2 immune responses. Thus, DNA sensing by cGAS contributes to type-2 immune responses and may represent a therapeutic target for allergic lung inflammation.
© 2025 The Author(s).
Product Citations: 154
In IScience on 16 May 2025 by Chenuet, P., Mellier, M., et al.
-
Genetics
-
Immunology and Microbiology
In British Journal of Pharmacology on 1 May 2025 by Pan, X., Ren, Z., et al.
Inflammatory bowel disease (IBD) is closely associated with immune dysfunction, where nutrient-mediated metabolic flux dictates immune cell fate and function. Thiamine is a central water-soluble vitamin involved in cellular energy metabolism, and its deficiency has been reported in IBD patients. However, whether thiamine deficiency is a cause or consequence of IBD pathogenesis remains unclear. The current study aimed to reveal the immunometabolic regulation of macrophages and underlying mechanism of thiamine deficiency in colitis development.
Thiamine deficiency was induced in C57BL/6 mice and bone marrow-derived macrophages (BMDMs), by administering a thiamine-deficient diet/medium together with pyrithiamine hydrobromide. The frequency of macrophage phenotypes and their intracellular metabolism were detected using flow cytometry and non-targeted metabolomics, respectively.
Thiamine deficiency aggravated ulcerative colitis in mice and promoted the infiltration of proinflammatory M1 macrophages in colonic lamina propria. Our mechanistic study revealed that thiamine deficiency impaired pyruvate dehydrogenase (PDH) activity, thereby reprogramming cellular glucose metabolism to enhance glycolysis and lactic acid accumulation in M1 macrophages. Using a well-established PDH inhibitor (CPI-613) and lactic acid dehydrogenase inhibitor (galloflavin), we further demonstrated that PDH inhibition mimics, while lactate dehydrogenase inhibition partially rescues, thiamine deficiency-induced proinflammatory macrophage infiltration and experimental colitis in mice.
Our study provides evidence linking thiamine deficiency with proinflammatory macrophage activation and colitis aggravation, suggesting that monitoring thiamine status and adjusting thiamine intake is necessary to protect against colitis.
© 2025 British Pharmacological Society.
-
Pharmacology
In NPJ Vaccines on 20 March 2025 by Garde, C., Pavlidis, M. A., et al.
Personalized cancer vaccines (PCVs) largely leverage neoantigens arising from somatic mutations, limiting their application to patients with relatively high tumor mutational burden (TMB). This underscores the need for alternative antigens to design PCVs for low TMB cancers. To this end, we substantiate endogenous retroviral elements (EVEs) as tumor antigens through large-scale genomic analyses of healthy tissues and solid cancers. These analyses revealed that the breadth of EVE expression in tumors stratify checkpoint inhibitor-treated melanoma patients into groups with differential overall and progression-free survival. To enable the design of PCVs containing EVE-derived epitopes with therapeutic potential, we developed a computational pipeline, ObsERV. We show that EVE-derived peptides are presented as epitopes on tumors and can be predicted by ObsERV. Preclinical testing of ObsERV demonstrates induction of sustained poly-functional CD4+ and CD8+ T-cell responses as well as long-term tumor protection. As such, EVEs may facilitate and improve PCVs, especially for low-TMB patients.
© 2025. The Author(s).
-
Cancer Research
-
Immunology and Microbiology
Myricetin protects mice against colitis by activating aryl hydrocarbon receptor signaling pathway.
In Food Nutrition Research on 20 February 2025 by Xu, T., Qu, X., et al.
Myricetin is a bioactive compound in many edible plants. We have previously demonstrated that myricetin could significantly protect mice against colitis by regulating Treg/Th17 balance, while underlying mechanism remains unclear. The current study aimed to unravel the potential regulating mechanism of myricetin.
The concentrations of 22 amino acids in colon were determined using HPLC-MS/MS and principal component analysis (PCA) was performed on the data. MetaboAnalyst was used to detect potential biological pathway influenced by myricetin. The results were further verified using qPCR, molecular docking method, and AhR inhibitor.
Studies had found that the biosynthesis of phenylalanine, tyrosine, and tryptophan; phenylalanine metabolism; and histidine metabolism were the most important pathways related to myricetin. Therefore, the aryl hydrocarbon receptor (AhR), which is closely related to the metabolism of tryptophan, phenylalanine, and tyrosine, was postulated to be the underlying signaling pathways. Furthermore, administration of myricet in significantly increased the relative expressions of CYP1A1 and CYP1B1, whereas AhR inhibitor abolished the amelioration of myricetin on DSS-induced colitis. Moreover, AhR inhibitor weakened the regulatory effect of myricetin on Treg/Th17 balance. Furthermore, the results obtained by the molecular docking method speculated that myricetin could bind to AhR as a ligand and activate AhR.
The results suggested that myricetin could exert its protection against dextran sulfate sodium (DSS)-induced colitis by activating AhR signaling pathway.
© 2025 Tao Xu et al.
-
FC/FACS
Virus replication is not required for oncolytic bovine herpesvirus-1 immunotherapy.
In Molecular Therapy. Oncology on 19 December 2024 by Baracuhy, E. M., Cormier, O., et al.
Oncolytic viruses are a promising approach for cancer treatment where viruses selectively target and kill cancer cells while also stimulating an immune response. Among viruses with this ability, bovine herpesvirus-1 (BoHV-1) has several advantages, including observations suggesting it may not require viral replication for its anti-cancer effects. We previously demonstrated that binding and penetration of enveloped virus particles are sufficient to trigger intrinsic and innate immune signaling in normal cells, while other groups have published the efficacy of non-replicating viruses as viable immunotherapies in different cancer models. In this work, we definitively show that live and UV-inactivated (UV) (non-replicating) BoHV-1-based regimens extend survival of tumor-bearing mice to similar degrees and induce infiltration of similar immune cell populations, with the exception of neutrophils. Transcriptomic analysis of tumors treated with either live or UV BoHV-1-based regimens revealed similar pathway enrichment and a subset of overlapping differentially regulated genes, suggesting live and UV BoHV-1 have similar mechanisms of activity. Last, we present a gene signature across our in vitro and in vivo models that could potentially be used to validate new BoHV-1 therapeutics. This work contributes to the growing body of literature showing that replication may not be necessary for therapeutic efficacy of viral immunotherapies.
© 2024 The Author(s).
-
Immunology and Microbiology
-
Veterinary Research
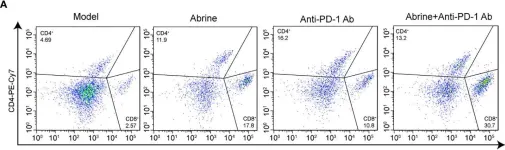
In Front Immunol on 19 June 2023 by Liang, X., Gao, H., et al.
Fig.7.A

-
FC/FACS
-
Collected and cropped from Front Immunol by CiteAb, provided under a CC-BY license
Image 1 of 6
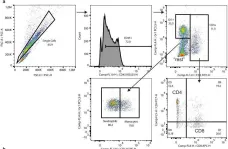
In Elife on 11 May 2020 by Sollberger, G., Streeck, R., et al.
Fig.5.A

-
FC/FACS
-
Collected and cropped from Elife by CiteAb, provided under a CC-BY license
Image 1 of 6
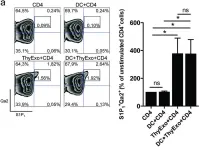
In Sci Rep on 8 November 2016 by Lundberg, V., Berglund, M., et al.
Fig.3.A

-
FC/FACS
-
Mus musculus (House mouse)
Collected and cropped from Sci Rep by CiteAb, provided under a CC-BY license
Image 1 of 6
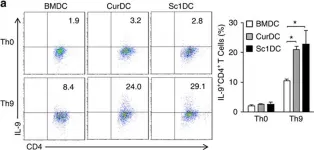
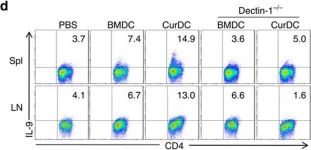
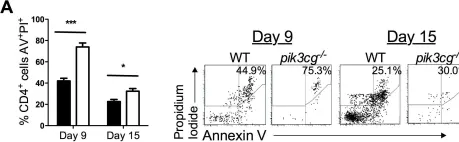
In Nat Commun on 5 August 2016 by Zhao, Y., Chu, X., et al.
Fig.1.A

-
FC/FACS
-
Mus musculus (House mouse)
Collected and cropped from Nat Commun by CiteAb, provided under a CC-BY license
Image 1 of 6
In Nat Commun on 5 August 2016 by Zhao, Y., Chu, X., et al.
Fig.7.D

-
FC/FACS
-
Mus musculus (House mouse)
Collected and cropped from Nat Commun by CiteAb, provided under a CC-BY license
Image 1 of 6
In PLoS One on 3 October 2012 by Comerford, I., Litchfield, W., et al.
Fig.6.A

-
FC/FACS
-
Mus musculus (House mouse)
Collected and cropped from PLoS One by CiteAb, provided under a CC-BY license
Image 1 of 6