Chronic obstructive pulmonary disease (COPD) is a heterogeneous condition, with varying clinical phenotypes and prognoses. Regulatory T cells (Tregs), particularly CD4+FOXP3+ T cell subpopulations, are crucial in modulating immune responses. This study investigates the distribution of two CD4+FOXP3+ T cell subpopulations in bronchoalveolar lavage fluid (BALF) from COPD patients and their association with disease phenotypes and prognosis. Patients were classified into Type A (lower frequencies of inflammatory FOXP3lo T cells) and Type B (higher frequencies of inflammatory FOXP3lo T cells). Type B COPD patients, who demonstrated more severe emphysema, heightened inflammatory responses, faster lung function decline, and more pronounced osteoporosis, showed a significant increase in FOXP3lo non-suppressive T cells. In contrast, Type A patients exhibited a higher proportion of FOXP3hi Treg cells, which correlated with milder disease phenotypes. The distinct distribution of CD4+FOXP3+ T cell subpopulations provides insights into the progression of COPD and suggests that these cells could serve as potential biomarkers for disease severity and prognosis. Further research may offer new therapeutic avenues by targeting these Treg subpopulations in COPD management.
© 2025. The Author(s).
Product Citations: 78
In Scientific Reports on 22 May 2025 by Hou, J., Zhao, J., et al.
-
FC/FACS
-
Homo sapiens (Human)
-
Immunology and Microbiology
Preprint on BioRxiv : the Preprint Server for Biology on 16 February 2025 by Pachane, B. C., Rodriguez, B. V., et al.
Abstract Extracellular vesicles may modify recipient cell behavior through multiple mechanisms, including interacting with the cell surface or internal membrane components and delivering luminal cargo to the cytoplasm. Here, we use a previously established ex vivo approach to investigate the cellular fate of EVs spiked into whole blood samples from nonhuman primate (NHP) and human donors and contrast these findings with results from in vitro assays. We report that EVs are internalized by NHP and human B cells while also associating to some degree with other PBMCs. EVs exhibit greater association with B cells in ex vivo whole blood compared to isolated B cells, suggesting that blood components may promote EV interactions or that cell isolation factors may inhibit this association. Cellular uptake of EVs involves clathrin-dependent endocytosis and may be aided by other pathways, including direct EV-cell membrane fusion. Overall, our data suggest that EV association, including uptake, by B cells occurs in at least two primate species. These findings highlight the potential to develop new strategies to either enhance or inhibit EV tropism toward B cells. Graphical Abstract
-
Immunology and Microbiology
In International Journal of Molecular Sciences on 20 January 2025 by Leize-Zal, E., Demini, L., et al.
Hemoglobin-based oxygen carriers have been developed to compensate the needs of blood for transfusions. Most of them were based on intracellular hemoglobin extracted from bovine or human blood, but unfortunately, this type of hemoglobin did not pass through the last steps of clinical trials. In this context, HEMARINA discovered a natural extracellular hemoglobin, possessing several advantages avoiding intracellular hemoglobin-related side effects. Many preclinical studies assessed the safety of M101 used in intravenous (IV) injection in rodents. To explore the safety of IV injections of M101 in large mammals, six dogs received each a single injection of liquid M101 according to a dose escalation with a 48 h follow-up. Then, two monkeys received multiple IV injections of the same dose of M101 every hour for seven hours. This study showed that single and multiple IV injections in dogs and monkeys did not cause clinical or histological lesions, nor did they induce immunological reactions. This makes M101 the best candidate to date for human use in emergency situations requiring blood and, in several diseases, causing hypoxia problems.
-
Veterinary Research
RhCMV Expands CCR5 Memory T Cells and promotes SIV reservoir genesis in the Gut Mucosa
Preprint on BioRxiv : the Preprint Server for Biology on 8 January 2025 by Perdios, C., Babu, N. S., et al.
Cytomegalovirus (CMV) is a prevalent β-herpesvirus that persists asymptomatically in immunocompetent hosts. In people with HIV-1 (PWH), CMV is associated with persistence of the HIV-1 reservoir and particular inflammatory related co-morbidities. The true causative role of CMV in HIV-associated pathologies remains unclear given that nearly all PWH are coinfected with CMV. In this study, we examined acute phase SIV dynamics in cohorts of rhesus macaques that were seropositive or -negative for rhesus CMV (RhCMV). We observed expansion of CCR5+ target CD4+ T cells in gut and lymph nodes (LN) that existed naturally in RhCMV-seropositive animals, the majority of which did not react to RhCMV lysate. These cells expressed high levels of the chemokine receptor CXCR3 and a ligand for this receptor, CXCL9, was systemically elevated in RhCMV-seropositive animals. RhCMV+ RMs also exhibited higher peak SIV viremia. CCR5 target memory CD4 T cells in the gut of RhCMV+ RMs were maintained during acute SIV and this was associated with greater seeding of SIV DNA in the intestine. Overall, our data suggests the ability of RhCMV to regulate chemotactic axes that direct lymphocyte trafficking and promote seeding of SIV in a diverse, polyclonal pool of memory CD4+ T cells.
-
Macaca mulatta (Rhesus Monkey)
-
Immunology and Microbiology
In ImmunoHorizons on 1 July 2024 by Hale, L. P., Macintyre, A. N., et al.
The critical importance of the thymus for generating new naive T cells that protect against novel infections and are tolerant to self-antigens has led to a recent revival of interest in monitoring thymic function in species other than humans and mice. Nonhuman primates such as rhesus macaques (Macaca mulatta) provide particularly useful animal models for translational research in immunology. In this study, we tested the performance of a 15-marker multicolor Ab panel for flow cytometric phenotyping of lymphocyte subsets directly from rhesus whole blood, with validation by thymectomy and T cell depletion. Immunohistochemical and multiplex RNA expression analysis of thymus tissue biopsies and molecular assays on PBMCs were used to further validate thymus function. Results identify Ab panels that can accurately classify rhesus naive T cells (CD3+CD45RA+CD197+ or CD3+CD28+CD95-) and recent thymic emigrants (CD8+CD28+CD95-CD103+CD197+) using just 100 µl of whole blood and commercially available fluorescent Abs. An immunohistochemical panel reactive with pan-cytokeratin (CK), CK14, CD3, Ki-67, CCL21, and TdT provides histologic evidence of thymopoiesis from formalin-fixed, paraffin-embedded thymus tissues. Identification of mRNAs characteristic of both functioning thymic epithelial cells and developing thymocytes and/or molecular detection of products of TCR gene rearrangement provide additional complementary methods to evaluate thymopoiesis, without requiring specific Abs. Combinations of multiparameter flow cytometry, immunohistochemistry, multiplex gene expression, and TCR excision circle assays can comprehensively evaluate thymus function in rhesus macaques while requiring only minimal amounts of peripheral blood or biopsied thymus tissue.
Copyright © 2024 The Authors.
-
Macaca mulatta (Rhesus Monkey)
In Elife on 29 April 2020 by Pallikkuth, S., Chaudhury, S., et al.
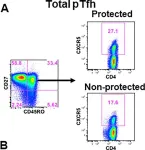
Fig.2.A

-
FC/FACS
-
Homo sapiens (Human)
Collected and cropped from Elife by CiteAb, provided under a CC-BY license
Image 1 of 2
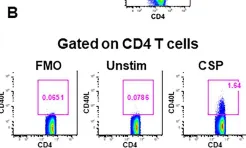
In Elife on 29 April 2020 by Pallikkuth, S., Chaudhury, S., et al.
Fig.2.B

-
FC/FACS
-
Homo sapiens (Human)
Collected and cropped from Elife by CiteAb, provided under a CC-BY license
Image 1 of 2