Regorafenib, a multi‑kinase inhibitor, has limited efficacy in hepatocellular carcinoma (HCC) due to dose‑-dependent toxicity. The present study explored whether low‑dose Regorafenib combined with Nifuroxazide exerts enhanced anti‑tumor effects in HCC models. In vitro experiments with HepG2 cells showed the combination inhibited cell viability, proliferation and migration, induced apoptosis and reduced expression of key proteins, including phosphorylated signal transducer and activator of transcription 3 (STAT3). In vivo, H22 tumor‑bearing mice treated with the combination exhibited suppressed tumor growth without systemic toxicity, along with changes in apoptotic proteins, enhanced tumor‑infiltrating immune cells and improved systemic immune responses. These findings indicated that the combination exerts enhanced suppression of HCC by inhibiting STAT3 and remodeling anti‑tumor immunity, providing preclinical evidence for a safe and effective strategy.
Product Citations: 283
In Oncology Reports on 1 April 2026 by Li, K., Chen, J., et al.
-
FC/FACS
-
Mus musculus (House mouse)
-
Cancer Research
-
Immunology and Microbiology
Timosaponin AIII enhances CAR-T cell potency and prevents relapse through impairing CAR-Tregs.
In Nature Communications on 31 March 2026 by Hou, M., Zhang, W., et al.
Chimeric antigen receptor (CAR)-T cell therapy has transformed treatment of relapsed/refractory DLBCL, yet resistance driven by regulatory T cells (Tregs) limits its efficacy. Here we identify Timosaponin AIII (TAIII), a clinical-stage natural product, as an effective modulator of CAR-T function that depletes CAR-Tregs while enhancing effector activity. Mechanistically, TAIII acts as an allosteric A2AR inhibitor by competing with cholesterol, suppressing CREB-dependent FoxP3 transcription and disrupting the A2AR-Treg axis. Ablation of A2AR or Tregs in vitro and in vivo abolishes TAIII activity, confirming specificity. Furthermore, TAIII reduces intratumoral Tregs, increases CD8⁺ T cells infiltration, and potentiates PD-1 blockade in solid tumor models. Importantly, TAIII promotes central memory T-cell formation and enhances CAR-T cytotoxic cytokine secretion. Combining or pretreating CAR-T cells with TAIII markedly improves antitumor efficacy and prevents late relapse across preclinical models. These findings establish TAIII as a combinatorial strategy to deplete CAR-Tregs, enhance CAR-T activity, and extend therapeutic durability.
© 2026. The Author(s).
-
FC/FACS
-
Mus musculus (House mouse)
-
Immunology and Microbiology
In Cancers on 3 March 2026 by Mavroeidi, D., Papanikolaou, C., et al.
Non-small cell lung cancer (NSCLC) is the most frequent type of lung cancer, and its main treatments include chemotherapy with genotoxic drugs and immunotherapy. Central to the cellular response to genotoxic stress is the DNA damage response (DDR) network, regulated by key kinases such as ataxia-telangiectasia mutated and Rad3-related (ATR). Herein, we tested the hypothesis that inhibition of ATR enhances the cytotoxicity of genotoxic agents and the antitumor immune response.
DDR-related parameters and redox status, expressed as GSH/GSSG ratio, and apurinic/apyrimidinic lesions, were evaluated in human (A549, H1299) and murine (LLC) NSCLC cell lines after co-exposure to ATR inhibitor (AZD6738) and ultraviolet C (UVC) irradiation or cisplatin. Using a syngeneic LLC model, treatments of AZD6738 alone or in combination with cisplatin and/or anti-programmed cell death 1 antibody (anti-PD1) were examined.
In all cell lines, combined treatment with AZD6738 and cisplatin or UVC irradiation markedly decreased cell viability, DNA repair efficiency, and GSH/GSSG ratios; increased drug-induced DNA damage; and augmented apurinic/apyrimidinic lesions. In vivo, following treatment with AZD6738 and cisplatin, flow cytometry analysis performed in tumor cells revealed an increased infiltration of CD3+ and CD8+ T cells, with the triple combination of AZD6738, cisplatin, and anti-PD1 achieving the strongest antitumor effect. The CD3+CD4-CD8- double-negative (DN) T cell population in tumor samples also emerged as a contributing factor in this context.
These results demonstrate that ATR blockade concurrently enhances the efficacy of genotoxic agents and immune checkpoint inhibitors, thus paving the way for combination therapies in NSCLC.
-
FC/FACS
-
Mus musculus (House mouse)
-
Cancer Research
-
Immunology and Microbiology
Tumor-derived aminopeptidase N promotes early stages of brain metastatic colonization.
In Cell Reports on 24 February 2026 by Bejarano, L., Hernández-Barranco, A., et al.
Metastasis is a highly inefficient process, with the vast majority of disseminated cancer cells failing to form secondary tumors. To establish brain metastases, cancer cells must traverse the blood-brain barrier and rapidly adapt to the specialized neural microenvironment. Here, we identify aminopeptidase N (CD13) as a pro-metastatic factor that supports the early stages of brain metastatic colonization. CD13 is upregulated in cancer cells during brain metastasis in both mouse models and human samples. CD13 knockdown significantly delayed metastatic growth and prolonged survival in mouse brain metastasis models while having no comparable effect on primary tumors. Loss- and gain-of-function experiments further revealed that CD13 enhances cancer cell seeding in the brain microenvironment. Together, these findings establish CD13 as an important mediator of brain metastatic colonization and a potential therapeutic target to prevent or delay disease progression.
Copyright © 2026 The Authors. Published by Elsevier Inc. All rights reserved.
-
Mus musculus (House mouse)
-
Cancer Research
In Nature Communications on 14 February 2026 by Zhang, Z., Li, X., et al.
Discovering more targets is of great importance for developing alternative interventions for tumor therapy. The roles of transmembrane protein 175 (TMEM175) in neurodegeneration diseases have been reported, however its functions in tumor immune surveillance are not known. We show that TMEM175 conditional knockout in macrophages inhibits the tumor growth and metastasis through promoting the anti-tumor immunity in the tumor microenvironment (TME), including elevated M1-like polarization, reduced M2-like polarization, and facilitated recruitment and activation of T cells and nature killer cells (NKs). The anti-tumor immunity is abrogated by caspase-1 inhibitor VX-765, anti-IL-1β, and anti-IL-18. Tmem175-/- bone marrow-derived macrophages (BMDMs) show enhanced tumor antigen cross-presentation that is further strengthened by IL-1β and IL-18. NLRP3 is robustly elicited in Tmem175-/- BMDMs by the tumor cell debris through lysosomal permeabilization and cathepsin B leakage. Finally, Tmem175-/- mice are more responsive to anti-PD-1. Our works implies TMEM175 to be a potential target for immunotherapy.
© 2026. The Author(s).
-
FC/FACS
-
Mus musculus (House mouse)
-
Cancer Research
-
Cell Biology
-
Immunology and Microbiology
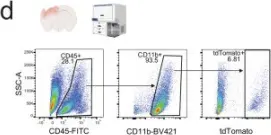
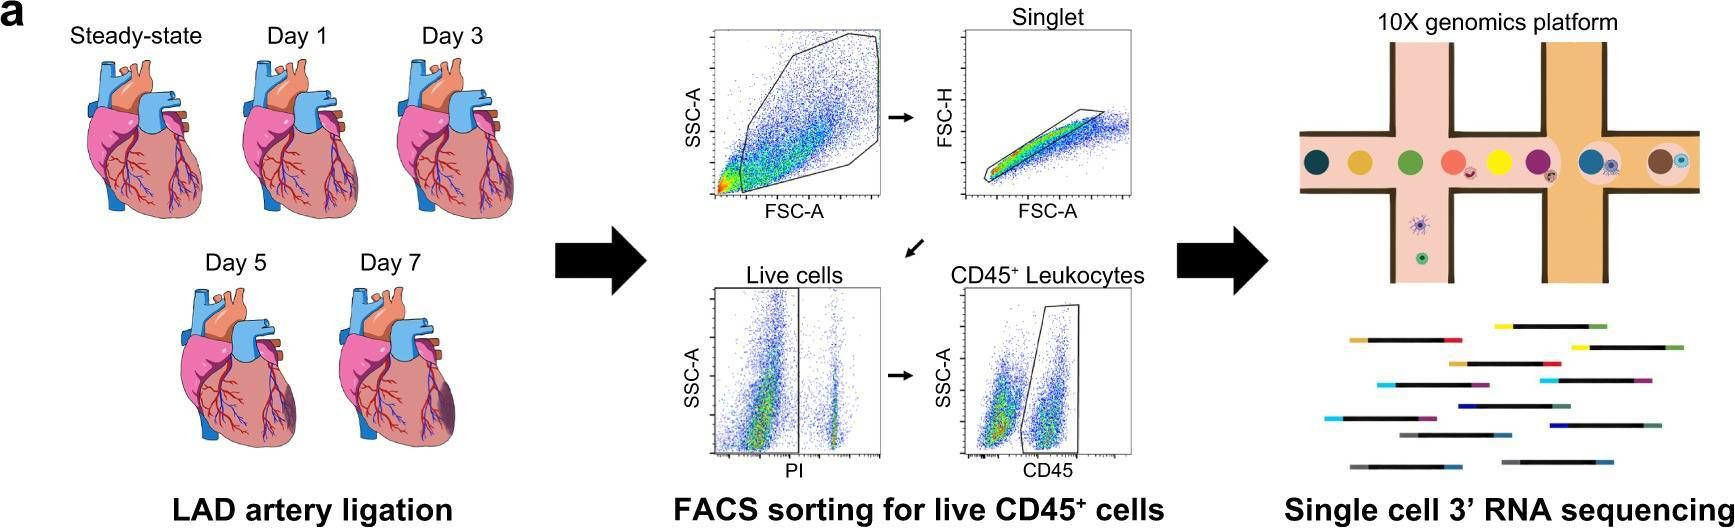
In Nat Commun on 7 October 2025 by Paladini, M. S., Yang, B. A., et al.
Fig.1.D

-
FC/FACS
-
Mus musculus (House mouse)
Collected and cropped from Nature Communications by CiteAb, provided under a CC-BY license
Image 1 of 5
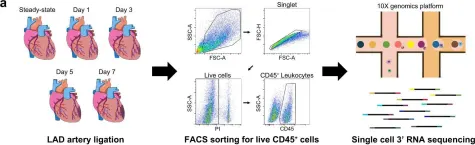
In Nat Commun on 6 August 2022 by Jung, S. H., Hwang, B. H., et al.
Fig.1.A
-
FC/FACS
-
Collected and cropped from Nature Communications by CiteAb, provided under a CC-BY license
Image 1 of 5
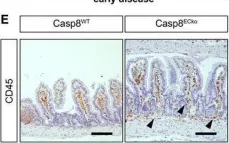
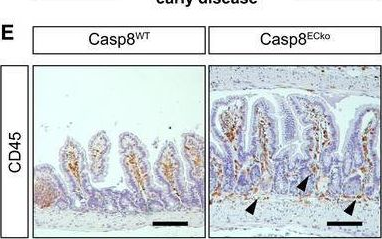
In EMBO Mol Med on 8 June 2022 by Tisch, N., Mogler, C., et al.
Fig.2.E
-
IHC
-
Mus musculus (House mouse)
Collected and cropped from EMBO Molecular Medicine by CiteAb, provided under a CC-BY license
Image 1 of 5
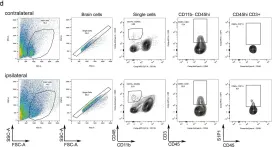
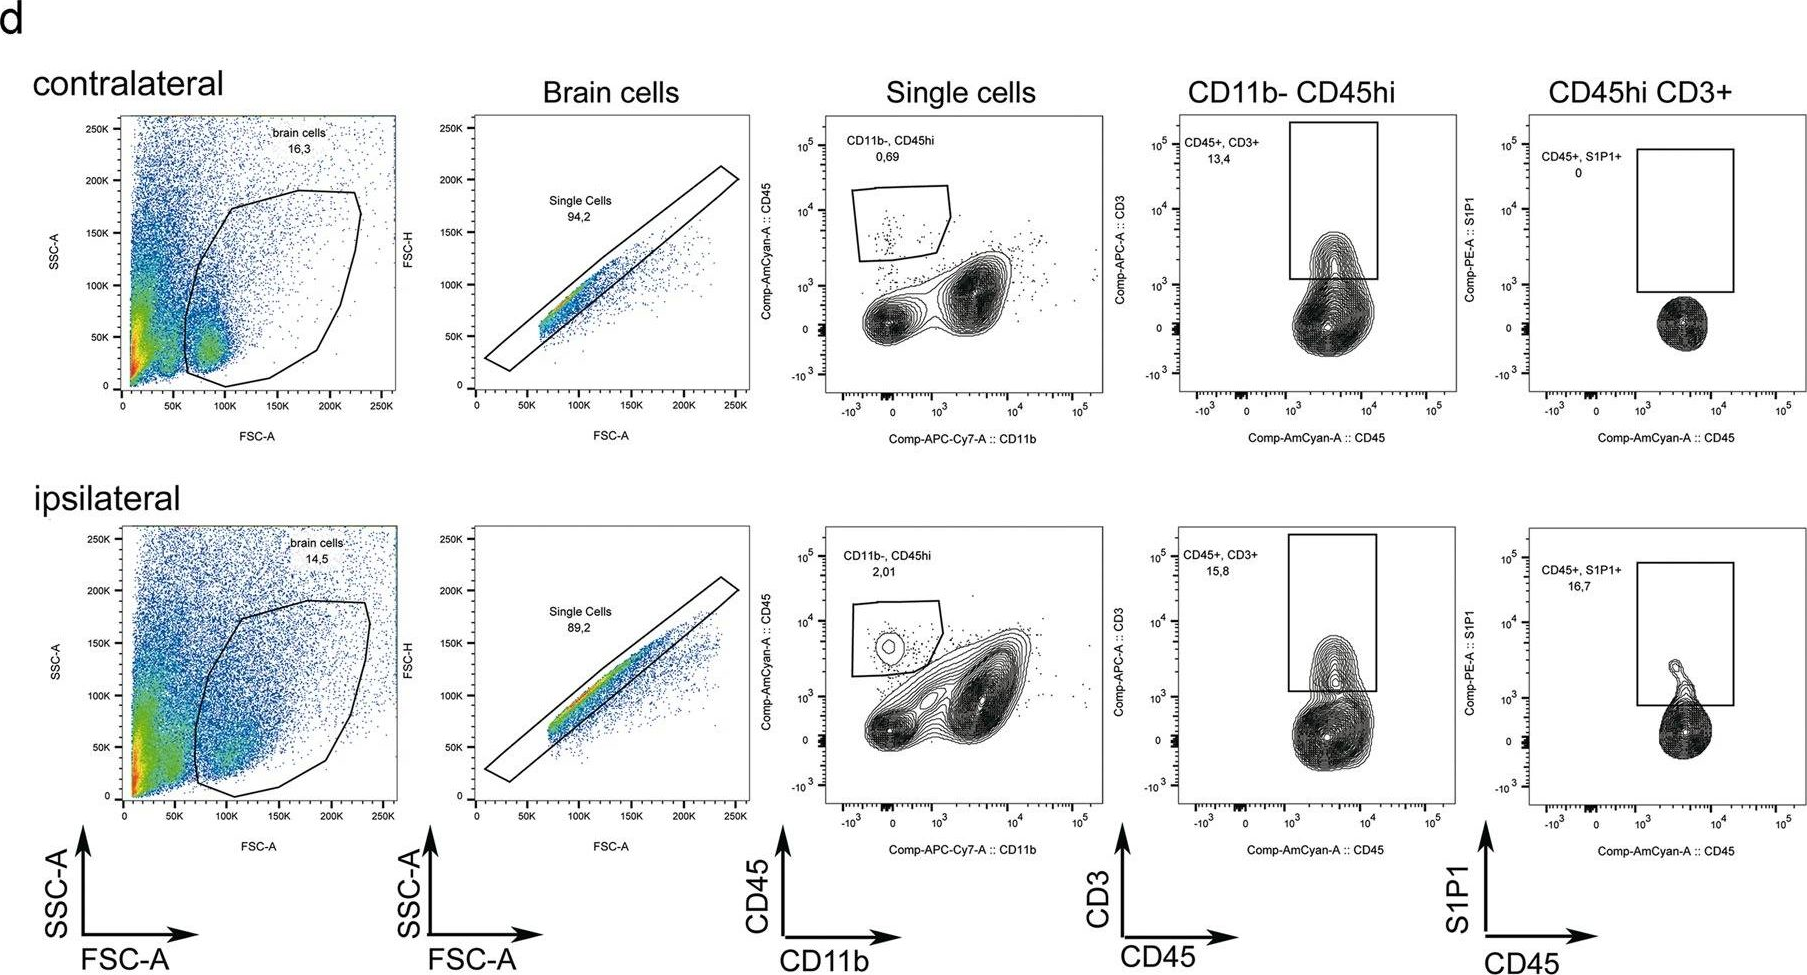
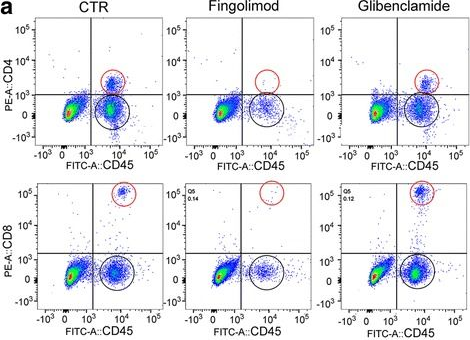
In Sci Rep on 5 June 2019 by Salas-Pérdomo, A., Miro-Mur, F., et al.
Fig.2.D
-
FC/FACS
-
Mus musculus (House mouse)
Collected and cropped from Scientific Reports by CiteAb, provided under a CC-BY license
Image 1 of 5
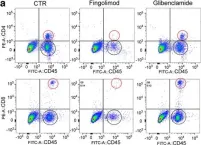
In J Neuroinflammation on 2 September 2017 by Gerzanich, V., Makar, T. K., et al.
Fig.5.A
-
FC/FACS
-
Mus musculus (House mouse)
Collected and cropped from Journal of Neuroinflammation by CiteAb, provided under a CC-BY license
Image 1 of 5