Alzheimer's disease (AD) is marked by amyloid β (Aβ) accumulation, neuroinflammation, and cognitive decline. While neuroinflammation is a key feature of AD, the potential involvement of bone marrow-derived cells in its pathology remains unclear. This study aimed to investigate the role of bone marrow-derived myeloid cells in driving neuroinflammation in AD.
We developed a transgenic mouse model (FAD4T) by overexpressing human APPSwe/Ind and PSEN1 M146L/L286V on a C57BL/6J background. FAD4T mice were characterized for hallmark AD features, including amyloid deposition, glial activation, and cognitive deficits. Additionally, single-cell transcriptomic analysis was performed to profile bone marrow and brain myeloid cells. Bone marrow transplantation experiments were conducted to assess the contribution of bone marrow-derived macrophages to neuroinflammation in AD.
FAD4T mice exhibited hallmark AD phenotypes such as amyloid deposition, glial activation, and cognitive impairment, alongside osteoporosis-like changes. Single-cell transcriptomic analysis identified a significant increase in bone marrow-derived macrophages in the brains of FAD4T mice. These cells showed upregulation of AD-related genes, including Cst7 and Ctsd, suggesting their active role in neuroinflammation. Bone marrow transplantation experiments further confirmed that bone marrow-derived macrophages contributed to the inflammatory processes in the AD brain.
Our findings demonstrate that bone marrow-derived myeloid cells infiltrate the brain and might play a critical role in driving neuroinflammation in AD. Targeting these cells may represent a novel therapeutic strategy for mitigating inflammation and disease progression in AD.
Our findings suggest that bone marrow-derived inflammation play a critical role in AD-associated inflammation, offering potential targets for therapeutic intervention such as Cst7 and Ctsd in bone marrow-derived myeloid cells.
© 2025 The Authors.
Product Citations: 221
In Journal of Orthopaedic Translation on 1 July 2025 by Pang, Y., Jia, D., et al.
In IScience on 20 June 2025 by Kaji, E., Nagao, J. I., et al.
Oropharyngeal candidiasis (OPC) is an opportunistic infection caused by Candida albicans. IL-17-mediated immunity driven by Th17 cells plays a crucial role in defense against this infection. However, the location and mechanism by which the Th17 immune response is induced during OPC remain unclear. Here, we show that C. albicans in the gut enhances protection against OPC. Intestinal C. albicans is taken up by the mucosal immune system and triggers a systemic C. albicans-responsive Th17 cell response. Upon oral infection with C. albicans, these Th17 cells migrate from the gut to the oral region and accumulate in the tongue tissue, resulting in antifungal immune responses. The pathobiont-reactive Th17 cells developed in the gut strongly provide IL-17A not only locally in the mouth but also systemically in the serum upon OPC. Our findings highlight that fungal pathogen-responsive Th17 cells in the gut-mouth axis enhance protection against OPC.
© 2025 The Author(s).
Targeting mTOR in myeloid cells prevents infection-associated inflammation.
In IScience on 18 April 2025 by Toner, Y. C., Munitz, J., et al.
Infections, cancer, and trauma can cause life-threatening hyperinflammation. In the present study, using single-cell RNA sequencing of circulating immune cells, we found that the mammalian target of rapamycin (mTOR) pathway plays a critical role in myeloid cell regulation in COVID-19 patients. Previously, we developed an mTOR-inhibiting nanobiologic (mTORi-nanobiologic) that efficiently targets myeloid cells and their progenitors in the bone marrow. In vitro, we demonstrated that mTORi-nanobiologics potently inhibit infection-associated inflammation in human primary immune cells. Next, we investigated the in vivo effect of mTORi-nanobiologics in mouse models of hyperinflammation and acute respiratory distress syndrome. Using 18F-FDG uptake and flow cytometry readouts, we found mTORi-nanobiologic therapy to efficiently reduce hematopoietic organ metabolic activity and inflammation to levels comparable to those of healthy control animals. Together, we show that regulating myelopoiesis with mTORi-nanobiologics is a compelling therapeutic strategy to prevent deleterious organ inflammation in infection-related complications.
© 2025 The Author(s).
-
Immunology and Microbiology
Monocyte-secreted Wnt reduces the efficiency of central nervous system remyelination.
In PLoS Biology on 1 April 2025 by Hill, B. M., Holloway, R. K., et al.
The regeneration of myelin in the central nervous system (CNS) reinstates nerve health and function, yet its decreased efficiency with aging and progression of neurodegenerative disease contributes to axonal loss and/or degeneration. Although CNS myeloid cells have been implicated in regulating the efficiency of remyelination, the distinct contribution of blood monocytes versus that of resident microglia is unclear. Here, we reveal that monocytes have non-redundant functions compared to microglia in regulating remyelination. Using a transgenic mouse in which classical monocytes have reduced egress from bone marrow (Ccr2-/-), we demonstrate that monocytes drive the timely onset of oligodendrocyte differentiation and myelin protein expression, yet impede myelin production. Ribonucleic acid sequencing revealed a Wnt signature in wild-type mouse lesion monocytes, which was confirmed in monocytes from multiple sclerosis white matter lesions and blood. Genetic or pharmacological inhibition of Wnt release by monocytes increased remyelination. Our findings reveal monocytes to be critical regulators of remyelination and identify monocytic Wnt signaling as a promising therapeutic target to inhibit for increased efficiency of CNS regeneration.
Copyright: © 2025 Hill et al. This is an open access article distributed under the terms of the Creative Commons Attribution License, which permits unrestricted use, distribution, and reproduction in any medium, provided the original author and source are credited.
In PLoS Pathogens on 1 March 2025 by Florêncio, M., Chagas, M. C. B., et al.
The present study investigates implications of a sub-chromosomal deletion in Leishmania infantum strains, the causative agent of American Visceral Leishmaniasis (AVL). Primarily found in New World strains, the deletion leads to the absence of the ecto-3'-nucleotidase/nuclease enzyme, impacting parasite virulence, pathogenicity, and drug susceptibility. The factors favoring prevalence and the widespread geographic distribution of these deleted mutant parasites (DEL) in the NW (NW) are discussed under the generated data.
We conducted phenotypic assessments of the sub-chromosomal deletion through in vitro assays with axenic parasites and experimental infections in both in vitro and in vivo models of vertebrate and invertebrate hosts using geographically diverse mutant field isolates.
Despite reduced pathogenicity, the DEL strains efficiently infect vertebrate hosts and exhibit relevant differences, including enhanced metacyclogenesis and colonization rates in sand flies, potentially facilitating transmission. This combination may represent a more effective way to maintain and disperse the transmission cycle of DEL strains.
Phenotypic assessments reveal altered parasite fitness, with potential enhanced transmissibility at the population level. Reduced susceptibility of DEL strains to miltefosine, a key drug in VL treatment, further complicates control efforts. The study underscores the importance of typing parasite genomes for surveillance and control, advocating for the sub-chromosomal deletion as a molecular marker in AVL management.
Copyright: © 2025 Florêncio et al. This is an open access article distributed under the terms of the Creative Commons Attribution License, which permits unrestricted use, distribution, and reproduction in any medium, provided the original author and source are credited.
-
FC/FACS
-
Leishmania infantum
-
Immunology and Microbiology
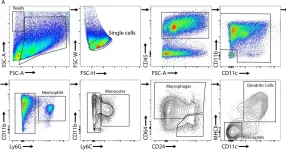
In Elife on 5 September 2024 by Roumelioti, F. M., Tzaferis, C., et al.
Fig.3.A

-
FC/FACS
-
Mus musculus (House mouse)
Collected and cropped from Elife by CiteAb, provided under a CC-BY license
Image 1 of 2
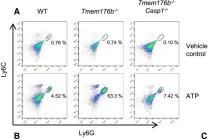
In Cancer Cell on 13 May 2019 by Segovia, M., Russo, S., et al.
Fig.1.A

-
FC/FACS
-
Mus musculus (House mouse)
Collected and cropped from Cancer Cell by CiteAb, provided under a CC-BY license
Image 1 of 2