The low survival rate of mesenchymal stem cells (MSCs) caused by anoikis, a form of apoptosis, limits the therapeutic efficacy of MSCs. As a proapoptotic molecule, mammalian Ste20-like kinase 1 (Mst1) can increase the production of reactive oxygen species (ROS), thereby promoting anoikis. Recently, we found that Mst1 inhibition could protect mouse bone marrow MSCs (mBMSCs) from H2O2-induced cell apoptosis by inducing autophagy and reducing ROS production. However, the influence of Mst1 inhibition on anoikis in mBMSCs remains unclear.
To investigate the mechanisms by which Mst1 inhibition acts on anoikis in isolated mBMSCs.
Poly-2-hydroxyethyl methacrylate-induced anoikis was used following the silencing of Mst1 expression by short hairpin RNA (shRNA) adenovirus transfection. Integrin (ITGs) were tested by flow cytometry. Autophagy and ITGα5β1 were inhibited using 3-methyladenine and small interfering RNA, respectively. The alterations in anoikis were measured by Terminal-deoxynucleoitidyl Transferase Mediated Nick End Labeling and anoikis assays. The levels of the anoikis-related proteins ITGα5, ITGβ1, and phospho-focal adhesion kinase and the activation of caspase 3 and the autophagy-related proteins microtubules associated protein 1 light chain 3 II/I, Beclin1 and p62 were detected by Western blotting.
In isolated mBMSCs, Mst1 expression was upregulated, and Mst1 inhibition significantly reduced cell apoptosis, induced autophagy and decreased ROS levels. Mechanistically, we found that Mst1 inhibition could upregulate ITGα5 and ITGβ1 expression but not ITGα4, ITGαv, or ITGβ3 expression. Moreover, autophagy induced by upregulated ITGα5β1 expression following Mst1 inhibition played an essential role in the protective efficacy of Mst1 inhibition in averting anoikis.
Mst1 inhibition ameliorated autophagy formation, increased ITGα5β1 expression, and decreased the excessive production of ROS, thereby reducing cell apoptosis in isolated mBMSCs. Based on these results, Mst1 inhibition may provide a promising strategy to overcome anoikis of implanted MSCs.
©The Author(s) 2023. Published by Baishideng Publishing Group Inc. All rights reserved.
Product Citations: 19
In World Journal of Stem Cells on 26 March 2023 by Zhang, T., Zhang, Q., et al.
-
FC/FACS
-
Mus musculus (House mouse)
-
Stem Cells and Developmental Biology
In eLife on 27 January 2023 by Tsyklauri, O., Chadimova, T., et al.
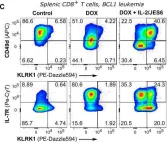
Regulatory T cells (Tregs) are indispensable for maintaining self-tolerance by suppressing conventional T cells. On the other hand, Tregs promote tumor growth by inhibiting anticancer immunity. In this study, we identified that Tregs increase the quorum of self-reactive CD8+ T cells required for the induction of experimental autoimmune diabetes in mice. Their major suppression mechanism is limiting available IL-2, an essential T-cell cytokine. Specifically, Tregs inhibit the formation of a previously uncharacterized subset of antigen-stimulated KLRK1+ IL-7R+ (KILR) CD8+ effector T cells, which are distinct from conventional effector CD8+ T cells. KILR CD8+ T cells show superior cell-killing abilities in vivo. The administration of agonistic IL-2 immunocomplexes phenocopies the absence of Tregs, i.e., it induces KILR CD8+ T cells, promotes autoimmunity, and enhances antitumor responses in mice. Counterparts of KILR CD8+ T cells were found in the human blood, revealing them as a potential target for immunotherapy.
© 2023, Tsyklauri et al.
-
FC/FACS
-
Mus musculus (House mouse)
-
Immunology and Microbiology
CMTM4 is a subunit of the IL-17 receptor and mediates autoimmune pathology.
In Nature Immunology on 1 November 2022 by Knizkova, D., Pribikova, M., et al.
Interleukin-17A (IL-17A) is a key mediator of protective immunity to yeast and bacterial infections but also drives the pathogenesis of several autoimmune diseases, such as psoriasis or psoriatic arthritis. Here we show that the tetra-transmembrane protein CMTM4 is a subunit of the IL-17 receptor (IL-17R). CMTM4 constitutively associated with IL-17R subunit C to mediate its stability, glycosylation and plasma membrane localization. Both mouse and human cell lines deficient in CMTM4 were largely unresponsive to IL-17A, due to their inability to assemble the IL-17R signaling complex. Accordingly, CMTM4-deficient mice had a severe defect in the recruitment of immune cells following IL-17A administration and were largely resistant to experimental psoriasis, but not to experimental autoimmune encephalomyelitis. Collectively, our data identified CMTM4 as an essential component of IL-17R and a potential therapeutic target for treating IL-17-mediated autoimmune diseases.
© 2022. The Author(s).
-
FC/FACS
-
Mus musculus (House mouse)
-
Immunology and Microbiology
-
Pathology
MAL suppresses OSCC tumorigenesis by maintaining epithelial cell differentiation
Preprint on BioRxiv : the Preprint Server for Biology on 2 December 2021 by Zhu, X., Liu, Z., et al.
Oral squamous cell carcinoma (OSCC) is widely recognized as an optimal model for precise medicine guided molecular biomarkers of cancer, however, few clinical practices were applied till now. Based on the data from our own studies and published papers, it was found that the expression of MAL was significantly decreased in epithelial cancer as compared with normal tissues, and exhibited a opposite association with pathological grade. To study the molecular events related to deficiency of MAL during carcinogenesis, occurrence and development, a Mal knockout mouse model was constructed and consistently reproduced and bred. The Mal knockout mice are highly vulnerable to tumor induction by carcinogen of 4NQO, evidenced by their extremely earlier carcinogenesis, higher incidence, and more aggressive growth. Analysis of scRNA-seq data indicated that Mal knockout mice lost the ability in maintaining epithelial cell differentiation and get more prone to carcinogen with a remarkably higher incidence of epithelial malignancy. Further analyses identified putative co-functional genes of MAL , including DSG1, AQP3 and S100A8 , which are key factors in maintaining epithelial cell differentiation. To conclude, the current study exhibits the clinical significance and explains the tumor suppressing function of MAL . The results also suggest the potential of MAL and its co-functional genes being biomarkers for designing the prevention and/or differentiation therapy strategies in OSCC. h4>Significance/h4> MAL is found to be strongly opposite with tumor pathological grade from clinical and in vivo studies in OSCC. We propose MAL and its co-functional genes, including DSG1, AQP3 and S100A8 , as key factors in maintaining epithelial cell differentiation and are valuable targets for designing prevention and differentiation therapy strategies in OSCC.
-
Mus musculus (House mouse)
Preprint on BioRxiv : the Preprint Server for Biology on 12 November 2021 by Tsyklauri, O., Chadimova, T., et al.
Regulatory T cells (Tregs) are indispensable for maintaining self-tolerance by suppressing conventional T cells. On the other hand, Tregs may promote tumor growth by inhibiting anti-cancer immunity. In this study, we identified that Tregs increase the quorum of self-reactive CD8 + T cells required for the induction of experimental autoimmune diabetes. Their major suppression mechanism is limiting available IL-2, an essential T-cell cytokine. Specifically, Tregs inhibit the formation of a previously uncharacterized subset of antigen-stimulated KLRK1 + IL7R + (KILR) CD8 + effector T cells, which are distinct from conventional effector CD8 + T cells. KILR CD8 + T cells show a superior cell killing abilities in vivo. The administration of agonistic IL-2 immunocomplexes phenocopies the absence of Tregs, i.e., it induces KILR CD8 + T cells, promotes autoimmunity, and enhances anti-tumor responses. Counterparts of KILR CD8 + T cells were found in the human blood, revealing them as a potential target for immunotherapy.
-
Immunology and Microbiology
In Elife on 27 January 2023 by Tsyklauri, O., Chadimova, T., et al.
Fig.7.C

-
FC/FACS
-
Mus musculus (House mouse)
Collected and cropped from Elife by CiteAb, provided under a CC-BY license
Image 1 of 1