Emerging evidence has supported a role for the immune system and liver in Alzheimer's disease (AD). However, our understanding of how hepatic immune cells are altered in AD is limited. We previously found that brain mucosal-associated invariant T (MAIT) cell numbers are increased in AD. Furthermore, loss of MAIT cells and their antigen-presenting molecule, MR1, reduced amyloid-β accumulation in the brain. MAIT cells are also significantly present in the liver. Therefore, we sought to analyze MAIT and other immune cells in the AD liver. Increased frequency of activated MAIT cells (but not conventional T cells) were found in 8-month-old 5XFAD mouse livers. Therefore, these data raise the possibility that there is a role for peripheral MAIT cells in AD pathology.
Copyright © 2024 Elsevier B.V. All rights reserved.
Product Citations: 116
Enrichment of liver MAIT cells in a mouse model of Alzheimer's disease.
In Journal of Neuroimmunology on 15 May 2024 by Wyatt-Johnson, S. K., Kersey, H. N., et al.
-
Immunology and Microbiology
-
Neuroscience
Multimodal stimulation screens reveal unique and shared genes limiting T cell fitness.
In Cancer Cell on 8 April 2024 by Lin, C. P., Lévy, P. L., et al.
Genes limiting T cell antitumor activity may serve as therapeutic targets. It has not been systematically studied whether there are regulators that uniquely or broadly contribute to T cell fitness. We perform genome-scale CRISPR-Cas9 knockout screens in primary CD8 T cells to uncover genes negatively impacting fitness upon three modes of stimulation: (1) intense, triggering activation-induced cell death (AICD); (2) acute, triggering expansion; (3) chronic, causing dysfunction. Besides established regulators, we uncover genes controlling T cell fitness either specifically or commonly upon differential stimulation. Dap5 ablation, ranking highly in all three screens, increases translation while enhancing tumor killing. Loss of Icam1-mediated homotypic T cell clustering amplifies cell expansion and effector functions after both acute and intense stimulation. Lastly, Ctbp1 inactivation induces functional T cell persistence exclusively upon chronic stimulation. Our results functionally annotate fitness regulators based on their unique or shared contribution to traits limiting T cell antitumor activity.
Copyright © 2024 The Authors. Published by Elsevier Inc. All rights reserved.
-
Mus musculus (House mouse)
-
Cancer Research
-
Immunology and Microbiology
In Nature Communications on 13 March 2024 by Long, J., Chen, X., et al.
T cell receptor (TCR)-engineered T cell therapy is a promising potential treatment for solid tumors, with preliminary efficacy demonstrated in clinical trials. However, obtaining clinically effective TCR molecules remains a major challenge. We have developed a strategy for cloning tumor-specific TCRs from long-term surviving patients who have responded to immunotherapy. Here, we report the identification of a TCR (10F04), which is human leukocyte antigen (HLA)-DRA/DRB1*09:01 restricted and human papillomavirus type 18 (HPV18) E784-98 specific, from a multiple antigens stimulating cellular therapy (MASCT) benefited metastatic cervical cancer patient. Upon transduction into human T cells, the 10F04 TCR demonstrated robust antitumor activity in both in vitro and in vivo models. Notably, the TCR effectively redirected both CD4+ and CD8+ T cells to specifically recognize tumor cells and induced multiple cytokine secretion along with durable antitumor activity and outstanding safety profiles. As a result, this TCR is currently being investigated in a phase I clinical trial for treating HPV18-positive cancers. This study provides an approach for developing safe and effective TCR-T therapies, while underscoring the potential of HLA class II-restricted TCR-T therapy as a cancer treatment.
© 2024. The Author(s).
-
FC/FACS
-
Mus musculus (House mouse)
-
Cancer Research
An “alert state” ribosome population acts as a master regulator of cytokine-mediated processes
Preprint on BioRxiv : the Preprint Server for Biology on 20 October 2023 by Dopler, A., Alkan, F., et al.
Inflammatory cytokines are pivotal to immune responses. Upon cytokine exposure, cells enter an “alert-state” that enhances their visibility to the immune system. Here, we identified an “alert-state” subpopulation of ribosomes (ASRs) defined by the presence of the P-stalk. We show that ASRs are formed in response to cytokines linked to tumor immunity, and are involved in the preferential translation of mRNAs vital for the cytokine response. Mechanistically, ASRs are required for the efficient translation of transmembrane domains of receptor molecules involved in cytokine-mediated processes. Importantly, loss of the ASR prevents CD8+ T cell recognition and killing, and inhibitory cytokines like TGFβ hinder ASR formation, suggesting that the ASR is a central regulatory hub upon which multiple signals converge. Thus, the ASR is an essential mediator of the cellular rewiring that occurs following cytokine exposure, via the translational regulation of this process.
-
Mus musculus (House mouse)
DNASE1L3 enhances antitumor immunity and suppresses tumor progression in colon cancer.
In JCI Insight on 8 September 2023 by Li, W., Nakano, H., et al.
DNASE1L3, an enzyme highly expressed in DCs, is functionally important for regulating autoimmune responses to self-DNA and chromatin. Deficiency of DNASE1L3 leads to development of autoimmune diseases in both humans and mice. However, despite the well-established causal relationship between DNASE1L3 and immunity, little is known about the involvement of DNASE1L3 in regulation of antitumor immunity, the foundation of modern antitumor immunotherapy. In this study, we identify DNASE1L3 as a potentially new regulator of antitumor immunity and a tumor suppressor in colon cancer. In humans, DNASE1L3 is downregulated in tumor-infiltrating DCs, and this downregulation is associated with poor patient prognosis and reduced tumor immune cell infiltration in many cancer types. In mice, Dnase1l3 deficiency in the tumor microenvironment enhances tumor formation and growth in several colon cancer models. Notably, the increased tumor formation and growth in Dnase1l3-deficient mice are associated with impaired antitumor immunity, as evidenced by a substantial reduction of cytotoxic T cells and a unique subset of DCs. Consistently, Dnase1l3-deficient DCs directly modulate cytotoxic T cells in vitro. To our knowledge, our study unveils a previously unknown link between DNASE1L3 and antitumor immunity and further suggests that restoration of DNASE1L3 activity may represent a potential therapeutic approach for anticancer therapy.
-
FC/FACS
-
Mus musculus (House mouse)
-
Cancer Research
-
Immunology and Microbiology
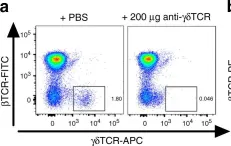
In Nat Commun on 25 April 2018 by Wunderlich, C. M., Ackermann, P. J., et al.
Fig.7.A

-
FC/FACS
-
Mus musculus (House mouse)
Collected and cropped from Nat Commun by CiteAb, provided under a CC-BY license
Image 1 of 3
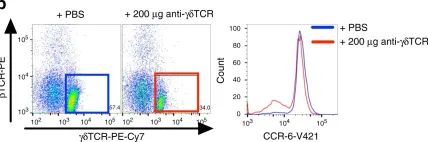
In Nat Commun on 25 April 2018 by Wunderlich, C. M., Ackermann, P. J., et al.
Fig.7.B

-
FC/FACS
-
Mus musculus (House mouse)
Collected and cropped from Nat Commun by CiteAb, provided under a CC-BY license
Image 1 of 3
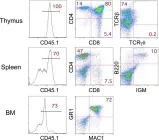
In Stem Cell Reports on 10 November 2015 by Ikawa, T., Masuda, K., et al.
Fig.2.C

-
FC/FACS
-
Mus musculus (House mouse)
Collected and cropped from Stem Cell Reports by CiteAb, provided under a CC-BY license
Image 1 of 3