This study reports engineered protease-stable, gramicidin-inspired, peptide-based proton transporter LD8Δ, with alternating L- and D-amino acid residues, to treat the highly chemoresistant, radioresistant, immunosuppressive metastatic renal cell carcinoma (RCC) cell line SK-RC-45. Exploiting the potential of the LD8Δ proton transporter, this study proposes mechanistically rational combination therapy with high translational potential. Current treatment methods involve multi-targeted tyrosine kinase inhibitors, which are accompanied by serious side-effects and exhibit an alarmingly low median overall survival. Computational and experimental data suggested that LD8Δ induced considerable membrane deformation, which supported the destabilization of the intracellular pH regulating mechanism observed in LD8Δ-treated RCC. This mechanistically rational combination therapy using LD8Δ and HIF-2α silencing siRNA induced mitochondrial depolarization, cell cycle arrest, apoptosis, reduction in angiogenesis and disruption of the major oncogenic signalling pathways in SK-RC-45 cells. The designed therapy upregulated the VHL tumour suppressor protein and downregulated HIF-2α protein expression, thus decreasing the activity of the HIF transcriptional factor, which is the master regulator causing clear cell RCC. Additionally, it upregulated DAB2IP and facilitated radiosensitization in the radioresistant SK-RC-45 cells. To the best of our knowledge, this is the first study demonstrating that a designed biocompatible proton transporter can potentiate immunotherapy against RCC by inducing the downregulation of the dual checkpoint proteins CD47, PD-L1 and ganglioside GM2, resulting in enhanced phagocytosis and preventing T cell inactivation and T cell apoptosis.
Product Citations: 342
In Biomaterials Science on 9 June 2025 by Mallick, A. M., Chatterjee, A., et al.
-
Cancer Research
-
Immunology and Microbiology
In ACS Nano on 8 April 2025 by Mo, X., shen, A., et al.
Macrophage plays critical roles in immune-related diseases, acting as a crucial therapeutic target for immunotherapy. Rational design and development of effective therapeutics for macrophage reprogramming are still challenging. Here, we rationally engineered polysaccharide nanoadjuvants to reprogram macrophage functions for enhanced immunotherapy in multiple diseases through a macrophage phenotype-specific nanoprobe (MPSNPr)-assisted high-throughput phenotypic screen. This MPSNPr exhibited high macrophage M1 phenotype specificity because of the formation of H-aggregates on the outer surface and the binding to glucose transporter 1 receptors by the polysaccharide nanocarrier. Based on this MPSNPr, a high-throughput platform was constructed and employed to screen a variety of pharmaceuticals for macrophage reprogramming, being able to identify both pro-inflammatory and anti-inflammatory drug candidates. Polysaccharide nanoadjuvants, Dex-BA and Dex-SAL, were rationally engineered with two potent candidates to amplify macrophage reprogramming efficacy both in vitro and in vivo. Dex-BA significantly inhibited tumor growth by inducing macrophage M1 polarization, dendritic cell maturation, and cytotoxic T cell activation in a mice melanoma model. Dex-SAL alleviated rheumatoid arthritis symptoms with reduced inflammation by reprogramming activated macrophages toward anti-inflammatory phenotype. Our work provides a robust strategy for the rational design and development of effective therapeutics for enhanced macrophage-mediated immunotherapy in diverse diseases.
-
Cancer Research
-
Immunology and Microbiology
Monocyte control of organismal energy homeostasis
Preprint on BioRxiv : the Preprint Server for Biology on 27 February 2025 by Martins, R., Blankehaus, B., et al.
SUMMARY Multicellular organisms rely on inter-organ communication networks to maintain vital parameters within a dynamic physiological range. Macrophages are central to this homeostatic control system, sensing deviations of those parameters and responding accordingly to support tissue function and organismal homeostasis. Here we demonstrate that dysregulation of iron metabolism in parenchyma cells, imposed by the deletion of ferritin H chain, is sensed by monocyte-derived macrophages. In response, macrophages derived from circulating monocytes support tissue function, energy metabolism and thermoregulation, as demonstrated in bone marrow chimeric and parabiotic mice. This salutary effect is contingent on a transcriptional program, controlled in macrophages by the transcription factor A mitochondria. This transcriptional response acts in a non-cell autonomous manner to support the mitochondria of parenchyma cells, irrespectively of mitochondrial transfer. In conclusion, monocyte-derived macrophages cross-regulate Fe and energy metabolism to support tissue function and organismal homeostasis.
Molecular control of PDPNhi macrophage subset induction by ADAP as a host defense in sepsis.
In JCI Insight on 4 February 2025 by Zhang, P., Wang, X., et al.
Induction of podoplanin (PDPN) expression is a critical response of macrophages to LPS stimulation or bacterial infection in sepsis, but how this key process of TLR4-stimulated PDPN upregulation is regulated and the effect of PDPN expression on macrophage function remain elusive. Here, we determined how this process is regulated in vitro and in vivo. PDPN failed to be upregulated in TLR4-stimulated macrophages deficient in adhesion and degranulation-promoting adapter protein (ADAP), which could be rescued by the reconstitution of ADAP. A distinct PDPNhi peritoneal macrophage (PM) subset, which exhibited an M2-like phenotype and enhanced phagocytic activity, was generated in WT but not in ADAP-deficient septic mice. The blockade of PDPNhi PMs mimicked the effect of ADAP deficiency, which exacerbated sepsis. Mechanistically, Bruton's tyrosine kinase-mediated (BTK-mediated) tyrosine phosphorylation of ADAP at Y571 worked together with mTOR to converge on STAT3 activation for the transactivation of the PDPN promoter. Moreover, agonist activation of STAT3 profoundly potentiated the PDPNhi PM subset generation and alleviated sepsis severity in mice. Together, our findings reveal a mechanism whereby ADAP resets macrophage function by controlling the TLR4-induced upregulation of PDPN as a host innate immune defense during sepsis.
-
Immunology and Microbiology
Tamm-Horsfall protein augments neutrophil NETosis during urinary tract infection.
In JCI Insight on 9 January 2025 by Mercado-Evans, V., Branthoover, H., et al.
Urinary neutrophils are a hallmark of urinary tract infection (UTI), yet the mechanisms governing their activation, function, and efficacy in controlling infection remain incompletely understood. Tamm-Horsfall glycoprotein (THP), the most abundant protein in urine, uses terminal sialic acids to bind an inhibitory receptor and dampen neutrophil inflammatory responses. We hypothesized that neutrophil modulation is an integral part of THP-mediated host protection. In a UTI model, THP-deficient mice showed elevated urinary tract bacterial burdens, increased neutrophil recruitment, and more severe tissue histopathological changes compared with WT mice. Furthermore, THP-deficient mice displayed impaired urinary NETosis during UTI. To investigate the effect of THP on NETosis, we coupled in vitro fluorescence-based NET assays, proteomic analyses, and standard and imaging flow cytometry with peripheral human neutrophils. We found that THP increases proteins involved in respiratory chain, neutrophil granules, and chromatin remodeling pathways; enhances NETosis in an ROS-dependent manner; and drives NET-associated morphologic features including nuclear decondensation. These effects were observed only in the presence of a NETosis stimulus and could not be solely replicated with equivalent levels of sialic acid alone. We conclude that THP is a critical regulator of NETosis in the urinary tract, playing a key role in host defense against UTI.
-
Immunology and Microbiology
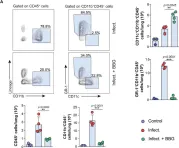
In Front Cell Infect Microbiol on 25 May 2021 by Santiago-Carvalho, I., de Almeida-Santos, G., et al.
Fig.4.A

-
FC/FACS
-
Collected and cropped from Front Cell Infect Microbiol by CiteAb, provided under a CC-BY license
Image 1 of 8
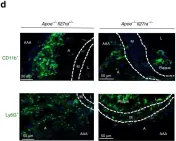
In Nat Commun on 6 November 2019 by Peshkova, I. O., Aghayev, T., et al.
Fig.2.D

-
IF
-
Mus musculus (House mouse)
Collected and cropped from Nat Commun by CiteAb, provided under a CC-BY license
Image 1 of 8
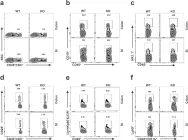
In Elife on 30 October 2019 by Sifuentes-Dominguez, L., Li, H., et al.
Fig.5.A

-
FC/FACS
-
Homo sapiens (Human)
Collected and cropped from Elife by CiteAb, provided under a CC-BY license
Image 1 of 8
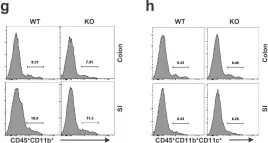
In Elife on 30 October 2019 by Sifuentes-Dominguez, L., Li, H., et al.
Fig.5.G

-
FC/FACS
-
Homo sapiens (Human)
Collected and cropped from Elife by CiteAb, provided under a CC-BY license
Image 1 of 8
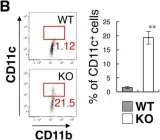
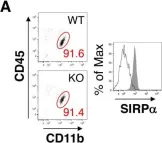
In Elife on 26 March 2019 by Sato-Hashimoto, M., Nozu, T., et al.
Fig.3.B

-
FC/FACS
-
Collected and cropped from Elife by CiteAb, provided under a CC-BY license
Image 1 of 8
In Elife on 26 March 2019 by Sato-Hashimoto, M., Nozu, T., et al.
Fig.3.A

-
FC/FACS
-
Collected and cropped from Elife by CiteAb, provided under a CC-BY license
Image 1 of 8
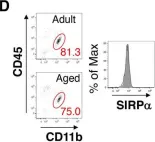
In Elife on 26 March 2019 by Sato-Hashimoto, M., Nozu, T., et al.
Fig.3.D

-
FC/FACS
-
Collected and cropped from Elife by CiteAb, provided under a CC-BY license
Image 1 of 8
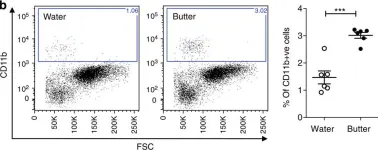
In Nat Commun on 23 December 2014 by Progatzky, F., Sangha, N. J., et al.
Fig.1.D

-
FC/FACS
-
Mus musculus (House mouse)
Collected and cropped from Nat Commun by CiteAb, provided under a CC-BY license
Image 1 of 8