Fibroblasts form a major component of the stroma in normal mammary tissue and breast tumors. Here, we have applied longitudinal single-cell transcriptome profiling of >45,000 fibroblasts in the mouse mammary gland across five different developmental stages and during oncogenesis. In the normal gland, diverse stromal populations were resolved, including lobular-like fibroblasts, committed preadipocytes and adipogenesis-regulatory, as well as cycling fibroblasts in puberty and pregnancy. These specialized cell types appear to emerge from CD34high mesenchymal progenitor cells, accompanied by elevated Hedgehog signaling. During late tumorigenesis, heterogeneous cancer-associated fibroblasts (CAFs) were identified in mouse models of breast cancer, including a population of CD34- myofibroblastic CAFs (myCAFs) that were transcriptionally and phenotypically similar to senescent CAFs. Moreover, Wnt9a was demonstrated to be a regulator of senescence in CD34- myCAFs. These findings reflect a diverse and hierarchically organized stromal compartment in the normal mammary gland that provides a framework to better understand fibroblasts in normal and cancerous states.
© 2025. The Author(s).
Product Citations: 150
Fibroblast hierarchy dynamics during mammary gland morphogenesis and tumorigenesis.
In The EMBO Journal on 1 June 2025 by Pascual, R., Cheng, J., et al.
Proinflammatory cytokines sensitise mesenchymal stromal cells to apoptosis.
In Cell Death Discovery on 28 March 2025 by Payne, N. L., Pang, S. H. M., et al.
Mesenchymal stromal cells (MSCs) exert broad therapeutic effects across a range of inflammatory diseases. Their mechanism of action has largely been attributed to paracrine signalling, orchestrated by an array of factors produced by MSCs that are collectively termed the "secretome". Strategies to enhance the release of these soluble factors by pre-exposure to inflammatory cytokines, a concept known as "licensing", is thought to provide a means of enhancing MSC efficacy. Yet, recent evidence shows that intravenously infused MSCs entrapped within the lungs undergo apoptosis, and their subsequent clearance by host phagocytes is essential for their therapeutic efficacy. We therefore sought to clarify the mechanisms governing regulated cell death in MSCs and how exposure to inflammatory cytokines impacts this process. Our results show that MSCs are relatively resistant to cell death induced via the extrinsic pathway of apoptosis, as well as stimuli that induce necroptosis, a form of regulated inflammatory cell death. Instead, efficient killing of MSCs required triggering of the mitochondrial pathway of apoptosis, via inhibition of the pro-survival proteins MCL-1 and BCL-XL. Apoptotic bodies were readily released by MSCs during cell disassembly, a process that was inhibited in vitro and in vivo when the apoptotic effectors BAK and BAX were genetically deleted. Licensing of MSCs by pre-exposure to the inflammatory cytokines TNF and IFN-γ increased the sensitivity of MSCs to intrinsic apoptosis in vitro and accelerated their in vivo clearance by host cells within the lungs after intravenous infusion. Taken together, our study demonstrates that inflammatory "licensing" of MSCs facilitates cell death by increasing their sensitivity to triggers of the intrinsic pathway of apoptosis and accelerating the kinetics of apoptotic cell disassembly.
© 2025. The Author(s).
In Development (Cambridge, England) on 15 November 2024 by Sá da Bandeira, D., Nevitt, C. D., et al.
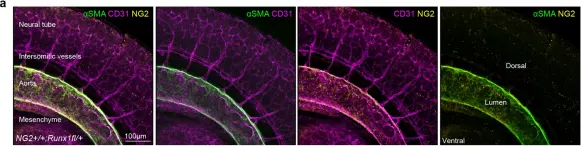
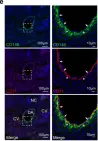
Hematopoietic stem cells (HSCs) sustain life-long hematopoiesis and emerge during mid-gestation from hemogenic endothelial progenitors via an endothelial-to-hematopoietic transition (EHT). The full scope of molecular mechanisms governing this process remains unclear. The NR4A subfamily of orphan nuclear receptors act as tumor suppressors in myeloid leukemogenesis and have never been implicated in HSC specification. Here, we report that Nr4a1 and Nr4a2 expression is upregulated in hemogenic endothelium during EHT. Progressive genetic ablation of Nr4a gene dosage results in a gradual decrease in numbers of nascent c-Kit+ hematopoietic progenitors in developing embryos, c-Kit+ cell cluster size in the dorsal aorta, and a block in HSC maturation, revealed by an accumulation of pro-HSCs and pre-HSC-type I cells and decreased numbers of pre-HSC-type II cells. Consistent with these observations, cells isolated from embryonic day 11.5 Nr4a1-/-; Nr4a2-/- aorta-gonads-mesonephros are devoid of in vivo long-term hematopoietic repopulating potential. Molecularly, employing spatial transcriptomic analysis we determined that the genetic ablation of Nr4a1 and Nr4a2 prevents Notch signaling from being downregulated in intra-aortic clusters and thus for pro-HSCs to mature into HSCs. Interestingly, this defect is partially rescued by ex vivo culture of dissected aorta-gonads-mesonephros with SCF, IL3 and FLT3L, which may bypass Notch-dependent regulation. Overall, our data reveal a role for the NR4A family of orphan nuclear receptors in EHT.
© 2024. Published by The Company of Biologists Ltd.
-
Stem Cells and Developmental Biology
In Cell Stem Cell on 3 October 2024 by Xu, L., Tan, C., et al.
While all eukaryotic cells are dependent on mitochondria for function, in a complex tissue, which cell type and which cell behavior are more sensitive to mitochondrial deficiency remain unpredictable. Here, we show that in the mouse airway, compromising mitochondrial function by inactivating mitochondrial protease gene Lonp1 led to reduced progenitor proliferation and differentiation during development, apoptosis of terminally differentiated ciliated cells and their replacement by basal progenitors and goblet cells during homeostasis, and failed airway progenitor migration into damaged alveoli following influenza infection. ATF4 and the integrated stress response (ISR) pathway are elevated and responsible for the airway phenotypes. Such context-dependent sensitivities are predicted by the selective expression of Bok, which is required for ISR activation. Reduced LONP1 expression is found in chronic obstructive pulmonary disease (COPD) airways with squamous metaplasia. These findings illustrate a cellular energy landscape whereby compromised mitochondrial function could favor the emergence of pathological cell types.
Copyright © 2024 Elsevier Inc. All rights reserved.
-
Cell Biology
-
Stem Cells and Developmental Biology
R-loop functions in Brca1-associated mammary tumorigenesis.
In Proceedings of the National Academy of Sciences of the United States of America on 13 August 2024 by Chiang, H. C., Qi, L., et al.
Deleterious accumulation of R-loops, a DNA-RNA hybrid structure, contributes to genome instability. They are associated with BRCA1 mutation-related breast cancer, an estrogen receptor α negative (ERα-) tumor type originating from luminal progenitor cells. However, a presumed causality of R-loops in tumorigenesis has not been established in vivo. Here, we overexpress mouse Rnaseh1 (Rh1-OE) in vivo to remove accumulated R-loops in Brca1-deficient mouse mammary epithelium (BKO). R-loop removal exacerbates DNA replication stress in proliferating BKO mammary epithelial cells, with little effect on homology-directed repair of double-strand breaks following ionizing radiation. Compared to their BKO counterparts, BKO-Rh1-OE mammary glands contain fewer luminal progenitor cells but more mature luminal cells. Despite a similar incidence of spontaneous mammary tumors in BKO and BKO-Rh1-OE mice, a significant percentage of BKO-Rh1-OE tumors express ERα and progesterone receptor. Our results suggest that rather than directly elevating the overall tumor incidence, R-loops influence the mammary tumor subtype by shaping the cell of origin for Brca1 tumors.
In Nat Commun on 23 February 2024 by Gonzalez Galofre, Z. N., Kilpatrick, A. M., et al.
Fig.1.A

-
IHC
-
Mus musculus (House mouse)
Collected and cropped from Nat Commun by CiteAb, provided under a CC-BY license
Image 1 of 2
In Nat Commun on 23 February 2024 by Gonzalez Galofre, Z. N., Kilpatrick, A. M., et al.
Fig.2.E

-
IHC
-
Mus musculus (House mouse)
Collected and cropped from Nat Commun by CiteAb, provided under a CC-BY license
Image 1 of 2