SUMMARY Multicellular organisms rely on inter-organ communication networks to maintain vital parameters within a dynamic physiological range. Macrophages are central to this homeostatic control system, sensing deviations of those parameters and responding accordingly to support tissue function and organismal homeostasis. Here we demonstrate that dysregulation of iron metabolism in parenchyma cells, imposed by the deletion of ferritin H chain, is sensed by monocyte-derived macrophages. In response, macrophages derived from circulating monocytes support tissue function, energy metabolism and thermoregulation, as demonstrated in bone marrow chimeric and parabiotic mice. This salutary effect is contingent on a transcriptional program, controlled in macrophages by the transcription factor A mitochondria. This transcriptional response acts in a non-cell autonomous manner to support the mitochondria of parenchyma cells, irrespectively of mitochondrial transfer. In conclusion, monocyte-derived macrophages cross-regulate Fe and energy metabolism to support tissue function and organismal homeostasis.
Product Citations: 83
Monocyte control of organismal energy homeostasis
Preprint on BioRxiv : the Preprint Server for Biology on 27 February 2025 by Martins, R., Blankehaus, B., et al.
In Nature Immunology on 1 December 2024 by Gámez-García, A., Espinosa-Alcantud, M., et al.
B lymphopoiesis is orchestrated by lineage-specific transcription factors. In B cell progenitors, lineage commitment is mediated by Pax5, which is commonly mutated in B cell acute lymphoblastic leukemia. Despite its essential role in immunity, the mechanisms regulating Pax5 function remain largely unknown. Here, we found that the NAD+-dependent enzyme SIRT7 coordinates B cell development through deacetylation of Pax5 at K198, which promotes Pax5 protein stability and transcriptional activity. Neither Pax5K198 deacetylated nor acetylated mimics rescued B cell differentiation in Pax5-/- pro-B cells, suggesting that B cell development requires Pax5 dynamic deacetylation. The Pax5K198 deacetylation mimic restored lineage commitment in Pax5-/- pro-B cells and B cell differentiation in Sirt7-/- pro-B cells, suggesting the uncoupling of differentiation from lineage commitment. The SIRT7-Pax5 interplay was conserved in B cell acute lymphoblastic leukemia, where SIRT7 expression correlated with good prognosis. Our findings reveal a crucial mechanism for B lymphopoiesis and highlight the relevance of sirtuins in immune function.
© 2024. The Author(s).
-
Immunology and Microbiology
Enkephalin-mediated modulation of basal somatic sensitivity by regulatory T cells in mice.
In eLife on 7 August 2024 by Aubert, N., Purcarea, M., et al.
CD4+CD25+Foxp3+ regulatory T cells (Treg) have been implicated in pain modulation in various inflammatory conditions. However, whether Treg cells hamper pain at steady state and by which mechanism is still unclear. From a meta-analysis of the transcriptomes of murine Treg and conventional T cells (Tconv), we observe that the proenkephalin gene (Penk), encoding the precursor of analgesic opioid peptides, ranks among the top 25 genes most enriched in Treg cells. We then present various evidence suggesting that Penk is regulated in part by members of the Tumor Necrosis Factor Receptor (TNFR) family and the transcription factor Basic leucine zipper transcription faatf-like (BATF). Using mice in which the promoter activity of Penk can be tracked with a fluorescent reporter, we also show that Penk expression is mostly detected in Treg and activated Tconv in non-inflammatory conditions in the colon and skin. Functionally, Treg cells proficient or deficient for Penk suppress equally well the proliferation of effector T cells in vitro and autoimmune colitis in vivo. In contrast, inducible ablation of Penk in Treg leads to heat hyperalgesia in both male and female mice. Overall, our results indicate that Treg might play a key role at modulating basal somatic sensitivity in mice through the production of analgesic opioid peptides.
© 2024, Aubert et al.
-
Immunology and Microbiology
In Cell Stem Cell on 7 March 2024 by Bonora, M., Morganti, C., et al.
Mitochondrial fatty acid oxidation (FAO) is essential for hematopoietic stem cell (HSC) self-renewal; however, the mechanism by which mitochondrial metabolism controls HSC fate remains unknown. Here, we show that within the hematopoietic lineage, HSCs have the largest mitochondrial NADPH pools, which are required for proper HSC cell fate and homeostasis. Bioinformatic analysis of the HSC transcriptome, biochemical assays, and genetic inactivation of FAO all indicate that FAO-generated NADPH fuels cholesterol synthesis in HSCs. Interference with FAO disturbs the segregation of mitochondrial NADPH toward corresponding daughter cells upon single HSC division. Importantly, we have found that the FAO-NADPH-cholesterol axis drives extracellular vesicle (EV) biogenesis and release in HSCs, while inhibition of EV signaling impairs HSC self-renewal. These data reveal the existence of a mitochondrial NADPH-cholesterol axis for EV biogenesis that is required for hematopoietic homeostasis and highlight the non-stochastic nature of HSC fate determination.
Copyright © 2024 The Author(s). Published by Elsevier Inc. All rights reserved.
-
Mus musculus (House mouse)
-
Cell Biology
-
Stem Cells and Developmental Biology
In Nature Communications on 2 January 2024 by Chi, W., Kang, N., et al.
Monocarboxylate transporter 1 (MCT1) exhibits essential roles in cellular metabolism and energy supply. Although MCT1 is highly expressed in activated B cells, it is not clear how MCT1-governed monocarboxylates transportation is functionally coupled to antibody production during the glucose metabolism. Here, we report that B cell-lineage deficiency of MCT1 significantly influences the class-switch recombination (CSR), rendering impaired IgG antibody responses in Mct1f/fMb1Cre mice after immunization. Metabolic flux reveals that glucose metabolism is significantly reprogrammed from glycolysis to oxidative phosphorylation in Mct1-deficient B cells upon activation. Consistently, activation-induced cytidine deaminase (AID), is severely suppressed in Mct1-deficient B cells due to the decreased level of pyruvate metabolite. Mechanistically, MCT1 is required to maintain the optimal concentration of pyruvate to secure the sufficient acetylation of H3K27 for the elevated transcription of AID in activated B cells. Clinically, we found that MCT1 expression levels are significantly upregulated in systemic lupus erythematosus patients, and Mct1 deficiency can alleviate the symptoms of bm12-induced murine lupus model. Collectively, these results demonstrate that MCT1-mediated pyruvate metabolism is required for IgG antibody CSR through an epigenetic dependent AID transcription, revealing MCT1 as a potential target for vaccine development and SLE disease treatment.
© 2024. The Author(s).
-
WB
-
Biochemistry and Molecular biology
-
Cell Biology
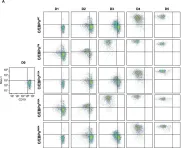
In Elife on 27 June 2023 by Torcal Garcia, G., Kowenz-Leutz, E., et al.
Fig.1.A

-
FC/FACS
-
Mus musculus (House mouse)
Collected and cropped from Elife by CiteAb, provided under a CC-BY license
Image 1 of 1