It is well-known that physical activity exerts health benefits, yet the potential impacts of early-life regular exercise on later-life health and lifespan remains poorly understood. Here, we demonstrate that 3 months of early-life exercise in mice results in lasting health benefits, extending healthspan, but not lifespan. C57BL/6J mice underwent swimming exercise from 1 to 4 months of age, followed by detraining for the remainder of their lives. While early-life exercise did not extend the overall lifespan, it significantly improved healthspan in both male and female mice, as evidenced by enhanced systemic metabolism, cardiovascular function, and muscle strength, as well as reduced systemic inflammation and frailty in aged mice. Multiple-organ transcriptome analyses identified enhanced fatty acid metabolism in skeletal muscles as a major feature in aged mice that underwent early-life exercise. These findings reveal the enduring long-term health benefits of early-life exercise, highlighting its pivotal role in improving healthspan.
© 2025. The Author(s).
Product Citations: 62
Early-life exercise extends healthspan but not lifespan in mice.
In Nature Communications on 9 July 2025 by Feng, M., Li, M., et al.
Cell enlargement modulated by GATA4 and YAP instructs the senescence-associated secretory phenotype.
In Nature Communications on 17 February 2025 by Joung, J., Heo, Y., et al.
Dynamic changes in cell size are associated with development and pathological conditions, including aging. Although cell enlargement is a prominent morphological feature of cellular senescence, its functional implications are unknown; moreover, how senescent cells maintain their enlargement state is less understood. Here we show that an extensive remodeling of actin cytoskeleton is necessary for establishing senescence-associated cell enlargement and pro-inflammatory senescence-associated secretory phenotype (SASP). This remodeling is attributed to a balancing act between the SASP regulator GATA4 and the mechanosensor YAP on the expression of the Rho family of GTPase RHOU. Genetic or pharmacological interventions that reduce cell enlargement attenuate SASP with minimal effect on senescence growth arrest. Mechanistically, actin cytoskeleton remodeling couples cell enlargement to the nuclear localization of GATA4 and NF-κB via the Linker of Nucleoskeleton and Cytoskeleton (LINC) complex. RhoU protein accumulates in mouse adipose tissue under senescence-inducing conditions. Furthermore, RHOU expression correlates with SASP expression in adipose tissue during human aging. Thus, our study highlights an unexpected instructive role of cell enlargement in modulating the SASP and reveals a mechanical branch in the senescence regulatory network.
© 2025. The Author(s).
-
WB
In Nature Communications on 12 August 2024 by Olan, I., Ando-Kuri, M., et al.
HMGA1 is an abundant non-histone chromatin protein that has been implicated in embryonic development, cancer, and cellular senescence, but its specific role remains elusive. Here, we combine functional genomics approaches with graph theory to investigate how HMGA1 genomic deposition controls high-order chromatin networks in an oncogene-induced senescence model. While the direct role of HMGA1 in gene activation has been described previously, we find little evidence to support this. Instead, we show that the heterogeneous linear distribution of HMGA1 drives a specific 3D chromatin organization. HMGA1-dense loci form highly interactive networks, similar to, but independent of, constitutive heterochromatic loci. This, coupled with the exclusion of HMGA1-poor chromatin regions, leads to coordinated gene regulation through the repositioning of genes. In the absence of HMGA1, the whole process is largely reversed, but many regulatory interactions also emerge, amplifying the inflammatory senescence-associated secretory phenotype. Such HMGA1-mediated fine-tuning of gene expression contributes to the heterogeneous nature of senescence at the single-cell level. A similar 'buffer' effect of HMGA1 on inflammatory signalling is also detected in lung cancer cells. Our study reveals a mechanism through which HMGA1 modulates chromatin compartmentalization and gene regulation in senescence and beyond.
© 2024. The Author(s).
In Oncogene on 1 July 2024 by Chen, W., Song, Y. S., et al.
Mortalin (encoded by HSPA9) is a mitochondrial chaperone often overexpressed in cancer through as-yet-unknown mechanisms. By searching different RNA-sequencing datasets, we found that ESRRA is a transcription factor highly correlated with HSPA9 in thyroid cancer, especially in follicular, but not C cell-originated, tumors. Consistent with this correlation, ESRRA depletion decreased mortalin expression only in follicular thyroid tumor cells. Further, ESRRA expression and activity were relatively high in thyroid tumors with oncocytic characteristics, wherein ESRRA and mortalin exhibited relatively high functional overlap. Mechanistically, ESRRA directly regulated HSPA9 transcription through a novel ESRRA-responsive element located upstream of the HSPA9 promoter. Physiologically, ESRRA depletion suppressed thyroid tumor cell survival via caspase-dependent apoptosis, which ectopic mortalin expression substantially abrogated. ESRRA depletion also effectively suppressed tumor growth and mortalin expression in the xenografts of oncocytic or ESRRA-overexpressing human thyroid tumor cells in mice. Notably, our Bioinformatics analyses of patient data revealed two ESRRA target gene clusters that contrast oncocytic-like and anaplastic features of follicular thyroid tumors. These findings suggest that ESRRA is a tumor-specific regulator of mortalin expression, the ESRRA-mortalin axis has higher significance in tumors with oncocytic characteristics, and ESRRA target gene networks can refine molecular classification of thyroid cancer.
© 2024. The Author(s), under exclusive licence to Springer Nature Limited.
-
Homo sapiens (Human)
-
Cancer Research
-
Endocrinology and Physiology
In Foods (Basel, Switzerland) on 27 May 2024 by Huang, Y., Peng, H., et al.
Anti-aging functional foods benefit the elderly. Telomeres are chromosomal ends that maintain genome stability extended by telomerase catalytic subunit TERT. Due to the end-replication problem, telomeres shorten after each cell cycle without telomerase in most human cells, and eventually the cell enters the senescence stage. Natural products can attenuate the aging process by increasing telomerase activity, such as TA-65. However, TA-65 is expensive. Other Chinese natural products may achieve comparable effects. Here, we found that Rosa roxburghii fruit extracts effectively increase TERT expression and telomerase activity in cultured human mesenchymal stem cells. Both R. roxburghii fruit extracts obtained by freeze-drying and spray-drying increased the activity of telomerase. R. roxburghii fruit extracts were able to reduce reactive oxygen species levels, enhance superoxide dismutase activity, and reduce DNA damage caused by oxidative stress or radiation. R. roxburghii fruit extracts promoted cell proliferation, improved senescent cell morphology, delayed replicative cellular senescence, attenuated cell cycle suppressors, and alleviated the senescence-associated secretory phenotype. Transcriptome and metabolic profiling revealed that R. roxburghii fruit extracts promote DNA replication and telomere maintenance pathways and decrease triglyceride levels. Overall, we provide a theoretical basis for the application of R. roxburghii fruit as an anti-aging product.
-
Homo sapiens (Human)
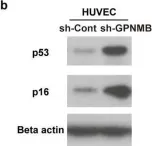
In Sci Rep on 20 April 2022 by Suda, M., Shimizu, I., et al.
Fig.1.B

-
WB
-
Collected and cropped from Sci Rep by CiteAb, provided under a CC-BY license
Image 1 of 9
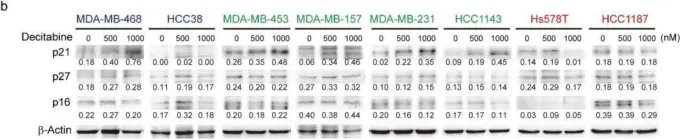
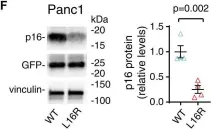
In Cancers (Basel) on 4 January 2022 by Nakajima, W., Miyazaki, K., et al.
Fig.5.B

-
WB
-
Homo sapiens (Human)
Collected and cropped from Cancers (Basel) by CiteAb, provided under a CC-BY license
Image 1 of 9
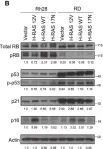
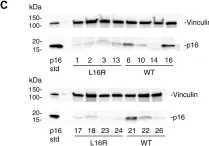
In Sci Rep on 13 August 2021 by Li, J. J., Kovach, A. R., et al.
Fig.4.B

-
WB
-
Collected and cropped from Sci Rep by CiteAb, provided under a CC-BY license
Image 1 of 9
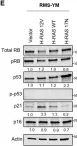
In Sci Rep on 13 August 2021 by Li, J. J., Kovach, A. R., et al.
Fig.6.E

-
WB
-
Collected and cropped from Sci Rep by CiteAb, provided under a CC-BY license
Image 1 of 9
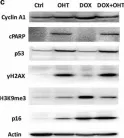
In J Biol Chem on 7 April 2021 by Horn, I. P., Marks, D. L., et al.
Fig.2.F

-
WB
-
Collected and cropped from J Biol Chem by CiteAb, provided under a CC-BY license
Image 1 of 9
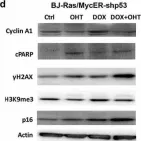
In J Biol Chem on 7 April 2021 by Horn, I. P., Marks, D. L., et al.
Fig.4.C

-
WB
-
Collected and cropped from J Biol Chem by CiteAb, provided under a CC-BY license
Image 1 of 9
In Cell Cycle on 12 December 2018 by Zhang, F., Zakaria, S. M., et al.
Fig.4.C

-
WB
-
Homo sapiens (Human)
Collected and cropped from Cell Cycle by CiteAb, provided under a CC-BY license
Image 1 of 9
In Cell Cycle on 12 December 2018 by Zhang, F., Zakaria, S. M., et al.
Fig.5.D

-
WB
-
Homo sapiens (Human)
Collected and cropped from Cell Cycle by CiteAb, provided under a CC-BY license
Image 1 of 9
In Sci Rep on 5 January 2017 by Gidfar, S., Milani, F. Y., et al.
Fig.5.C

-
WB
-
Collected and cropped from Sci Rep by CiteAb, provided under a CC-BY license
Image 1 of 9