Polo-like kinase 1 (plk1) is a conserved regulator of cell division. During prophase, plk1 phosphorylates direct substrates and is involved in activation of the cyclin-dependent kinase 1 (cdk1). However, the exact functions of plk1 in prophase remain incompletely understood. By testing several cell lines and small-molecule inhibitors, we confirm that plk1 inhibition causes a delay in mitotic entry. We show that cells are delayed in a prophase-like state displaying progressively condensing chromosomes, increased microtubule dynamics, reorganization of the actin cortex, while the nuclear envelope remains intact. We show that during this prolonged prophase cdk1 activity increases gradually over several hours with individual cells stochastically reaching the entry threshold, explaining the highly variable timing of mitotic entry. We then use phosphoproteomics to characterize this prolonged prophase state revealing for the first time phosphosites specific to prophase including several regulators of chromatin organization and the cytoskeleton. Together, we show that plk1 functions as a catalyst of prophase to prometaphase transition, and by using plk1 inhibition as a tool, we identify early changes in the phosphoproteome as the cell prepares for division.
Product Citations: 68
Plk1 inhibition delays mitotic entry revealing prophase-specific changes to the phosphoproteome
Preprint on BioRxiv : the Preprint Server for Biology on 6 April 2024 by Gobran, M., Welp, L., et al.
-
Cell Biology
In The Journal of Veterinary Medical Science / the Japanese Society of Veterinary Science on 18 October 2023 by Shinada, M., Kato, D., et al.
Podoplanin (PDPN) is a prognostic factor and is involved in several mechanisms of tumor progression in human squamous cell carcinoma (SCC). Canine non-tonsillar SCC (NTSCC) is a common oral tumor in dogs and has a highly invasive characteristic. In this study, we investigated the function of PDPN in canine NTSCC. In canine NTSCC clinical samples, PDPN overexpression was observed in 80% of dogs with NTSCC, and PDPN expression was related to ki67 expression. In PDPN knocked-out canine NTSCC cells, cell proliferation, cancer stemness, and migration were suppressed. As the mechanism of PDPN-mediated cell proliferation, PDPN knocked-out induced apoptosis and G2/M cell cycle arrest in canine NTSCC cells. These findings suggest that PDPN promotes tumor malignancies and may be a novel biomarker and therapeutic target for canine NTSCC.
-
Cancer Research
-
Veterinary Research
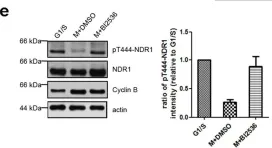
A ROS-dependent mechanism promotes CDK2 phosphorylation to drive progression through S phase.
In Developmental Cell on 25 July 2022 by Kirova, D. G., Judasova, K., et al.
Reactive oxygen species (ROS) at the right concentration promote cell proliferation in cell culture, stem cells, and model organisms. However, the mystery of how ROS signaling is coordinated with cell cycle progression and integrated into the cell cycle control machinery on the molecular level remains unsolved. Here, we report increasing levels of mitochondrial ROS during the cell cycle in human cell lines that target cyclin-dependent kinase 2 (CDK2). Chemical and metabolic interferences with ROS production decrease T-loop phosphorylation on CDK2 and so impede its full activation and thus its efficient DNA replication. ROS regulate CDK2 activity through the oxidation of a conserved cysteine residue near the T-loop, which prevents the binding of the T-loop phosphatase KAP. Together, our data reveal how mitochondrial metabolism is coupled with DNA replication and cell cycle progression via ROS, thereby demonstrating how KAP activity toward CDKs can be cell cycle regulated.
Copyright © 2022 The Author(s). Published by Elsevier Inc. All rights reserved.
-
Homo sapiens (Human)
-
Stem Cells and Developmental Biology
In eLife on 13 June 2022 by Mitra, R., Adams, C. M., et al.
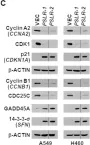
Quantification of gene dependency across hundreds of cell lines using genome-scale CRISPR screens has revealed co-essential pathways/modules and critical functions of uncharacterized genes. In contrast to protein-coding genes, robust CRISPR-based loss-of-function screens are lacking for long noncoding RNAs (lncRNAs), which are key regulators of many cellular processes, leaving many essential lncRNAs unidentified and uninvestigated. Integrating copy number, epigenetic, and transcriptomic data of >800 cancer cell lines with CRISPR-derived co-essential pathways, our method recapitulates known essential lncRNAs and predicts proliferation/growth dependency of 289 poorly characterized lncRNAs. Analyzing lncRNA dependencies across 10 cancer types and their expression alteration by diverse growth inhibitors across cell types, we prioritize 30 high-confidence pan-cancer proliferation/growth-regulating lncRNAs. Further evaluating two previously uncharacterized top proliferation-suppressive lncRNAs (PSLR-1, PSLR-2) showed they are transcriptionally regulated by p53, induced by multiple cancer treatments, and significantly correlate to increased cancer patient survival. These lncRNAs modulate G2 cell cycle-regulating genes within the FOXM1 transcriptional network, inducing a G2 arrest and inhibiting proliferation and colony formation. Collectively, our results serve as a powerful resource for exploring lncRNA-mediated regulation of cellular fitness in cancer, circumventing current limitations in lncRNA research.
© 2022, Mitra et al.
-
WB
-
Homo sapiens (Human)
-
Cancer Research
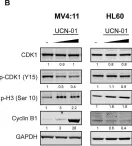
In Nature Communications on 19 May 2022 by Baran, N., Lodi, A., et al.
T-cell acute lymphoblastic leukemia (T-ALL) is commonly driven by activating mutations in NOTCH1 that facilitate glutamine oxidation. Here we identify oxidative phosphorylation (OxPhos) as a critical pathway for leukemia cell survival and demonstrate a direct relationship between NOTCH1, elevated OxPhos gene expression, and acquired chemoresistance in pre-leukemic and leukemic models. Disrupting OxPhos with IACS-010759, an inhibitor of mitochondrial complex I, causes potent growth inhibition through induction of metabolic shut-down and redox imbalance in NOTCH1-mutated and less so in NOTCH1-wt T-ALL cells. Mechanistically, inhibition of OxPhos induces a metabolic reprogramming into glutaminolysis. We show that pharmacological blockade of OxPhos combined with inducible knock-down of glutaminase, the key glutamine enzyme, confers synthetic lethality in mice harboring NOTCH1-mutated T-ALL. We leverage on this synthetic lethal interaction to demonstrate that IACS-010759 in combination with chemotherapy containing L-asparaginase, an enzyme that uncovers the glutamine dependency of leukemic cells, causes reduced glutaminolysis and profound tumor reduction in pre-clinical models of human T-ALL. In summary, this metabolic dependency of T-ALL on OxPhos provides a rational therapeutic target.
© 2022. The Author(s).
-
Biochemistry and Molecular biology
-
Cancer Research
-
Cell Biology
-
Immunology and Microbiology
In Elife on 13 June 2022 by Mitra, R., Adams, C. M., et al.
Fig.6.C

-
WB
-
Collected and cropped from Elife by CiteAb, provided under a CC-BY license
Image 1 of 14
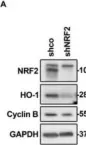
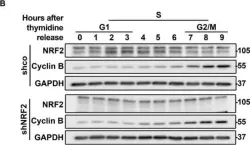
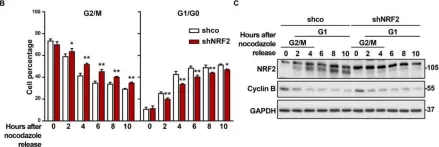
In Antioxidants (Basel) on 11 May 2022 by Lastra, D., Escoll, M., et al.
Fig.1.A

-
WB
-
Collected and cropped from Antioxidants (Basel) by CiteAb, provided under a CC-BY license
Image 1 of 14
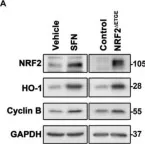
In Antioxidants (Basel) on 11 May 2022 by Lastra, D., Escoll, M., et al.
Fig.2.A

-
WB
-
Collected and cropped from Antioxidants (Basel) by CiteAb, provided under a CC-BY license
Image 1 of 14
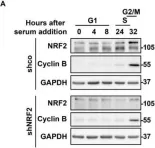
In Antioxidants (Basel) on 11 May 2022 by Lastra, D., Escoll, M., et al.
Fig.3.A

-
WB
-
Collected and cropped from Antioxidants (Basel) by CiteAb, provided under a CC-BY license
Image 1 of 14
In Antioxidants (Basel) on 11 May 2022 by Lastra, D., Escoll, M., et al.
Fig.4.B

-
WB
-
Collected and cropped from Antioxidants (Basel) by CiteAb, provided under a CC-BY license
Image 1 of 14
In Antioxidants (Basel) on 11 May 2022 by Lastra, D., Escoll, M., et al.
Fig.5.B

-
WB
-
Collected and cropped from Antioxidants (Basel) by CiteAb, provided under a CC-BY license
Image 1 of 14
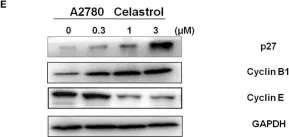
In Front Oncol on 13 February 2019 by Xu, L. N., Zhao, N., et al.
Fig.2.E

-
WB
-
Collected and cropped from Front Oncol by CiteAb, provided under a CC-BY license
Image 1 of 14
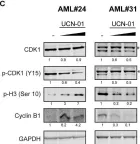
In Oncotarget on 22 May 2018 by Camgoz, A., Paszkowski-Rogacz, M., et al.
Fig.6.C

-
WB
-
Collected and cropped from Oncotarget by CiteAb, provided under a CC-BY license
Image 1 of 14
In Oncotarget on 22 May 2018 by Camgoz, A., Paszkowski-Rogacz, M., et al.
Fig.6.B

-
WB
-
Collected and cropped from Oncotarget by CiteAb, provided under a CC-BY license
Image 1 of 14
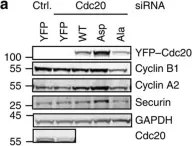
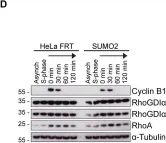
In Nat Commun on 10 March 2016 by Hein, J. B. & Nilsson, J.
Fig.5.A

-
WB
-
Homo sapiens (Human)
Collected and cropped from Nat Commun by CiteAb, provided under a CC-BY license
Image 1 of 14
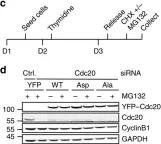
In Nat Commun on 10 March 2016 by Hein, J. B. & Nilsson, J.
Fig.5.C

-
WB
-
Homo sapiens (Human)
Collected and cropped from Nat Commun by CiteAb, provided under a CC-BY license
Image 1 of 14
In Sci Rep on 9 June 2015 by Yan, M., Chu, L., et al.
Fig.3.E

-
WB
-
Homo sapiens (Human)
Collected and cropped from Sci Rep by CiteAb, provided under a CC-BY license
Image 1 of 14
In PLoS One on 28 June 2014 by Schou, J., Kelstrup, C. D., et al.
Fig.4.D

-
WB
-
Homo sapiens (Human)
Collected and cropped from PLoS One by CiteAb, provided under a CC-BY license
Image 1 of 14
In PLoS One on 11 December 2013 by Huang, Y., Sramkoski, R. M., et al.
Fig.3.A

-
WB
-
Homo sapiens (Human)
Collected and cropped from PLoS One by CiteAb, provided under a CC-BY license
Image 1 of 14