The blood-brain barrier (BBB) protects the brain and maintains neuronal homeostasis. BBB properties can vary between brain regions to support regional functions, yet how BBB heterogeneity occurs is poorly understood. Here, we used single-cell and spatial transcriptomics to compare the mouse median eminence, one of the circumventricular organs that has naturally leaky blood vessels, with the cortex. We identified hundreds of molecular differences in endothelial cells (ECs) and perivascular cells, including astrocytes, pericytes and fibroblasts. Using electron microscopy and an aqueous-based tissue-clearing method, we revealed distinct anatomical specializations and interaction patterns of ECs and perivascular cells in these regions. Finally, we identified candidate regionally enriched EC-perivascular cell ligand-receptor pairs. Our results indicate that both molecular specializations in ECs and unique EC-perivascular cell interactions contribute to BBB functional heterogeneity. This platform can be used to investigate BBB heterogeneity in other regions and may facilitate the development of central nervous system region-specific therapeutics.
© 2024. The Author(s).
Product Citations: 28
In Nature Neuroscience on 1 October 2024 by Pfau, S. J., Langen, U. H., et al.
-
Mus musculus (House mouse)
-
Cardiovascular biology
-
Neuroscience
In eLife on 6 June 2024 by Verma, M., Asakura, Y., et al.
Endothelial and skeletal muscle lineages arise from common embryonic progenitors. Despite their shared developmental origin, adult endothelial cells (ECs) and muscle stem cells (MuSCs; satellite cells) have been thought to possess distinct gene signatures and signaling pathways. Here, we shift this paradigm by uncovering how adult MuSC behavior is affected by the expression of a subset of EC transcripts. We used several computational analyses including single-cell RNA-seq (scRNA-seq) to show that MuSCs express low levels of canonical EC markers in mice. We demonstrate that MuSC survival is regulated by one such prototypic endothelial signaling pathway (VEGFA-FLT1). Using pharmacological and genetic gain- and loss-of-function studies, we identify the FLT1-AKT1 axis as the key effector underlying VEGFA-mediated regulation of MuSC survival. All together, our data support that the VEGFA-FLT1-AKT1 pathway promotes MuSC survival during muscle regeneration, and highlights how the minor expression of select transcripts is sufficient for affecting cell behavior.
© 2024, Verma et al.
-
Mus musculus (House mouse)
-
Stem Cells and Developmental Biology
CDK1 inhibition reduces osteogenesis in endothelial cells in vascular calcification.
In JCI Insight on 8 March 2024 by Zhao, Y., Yang, Y., et al.
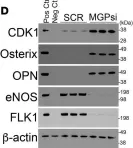
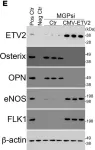
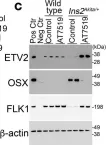
Vascular calcification is a severe complication of cardiovascular diseases. Previous studies demonstrated that endothelial lineage cells transitioned into osteoblast-like cells and contributed to vascular calcification. Here, we found that inhibition of cyclin-dependent kinase (CDK) prevented endothelial lineage cells from transitioning to osteoblast-like cells and reduced vascular calcification. We identified a robust induction of CDK1 in endothelial cells (ECs) in calcified arteries and showed that EC-specific gene deletion of CDK1 decreased the calcification. We found that limiting CDK1 induced E-twenty-six specific sequence variant 2 (ETV2), which was responsible for blocking endothelial lineage cells from undergoing osteoblast differentiation. We also found that inhibition of CDK1 reduced vascular calcification in a diabetic mouse model. Together, the results highlight the importance of CDK1 suppression and suggest CDK1 inhibition as a potential option for treating vascular calcification.
-
WB
-
Mus musculus (House mouse)
In Cell on 25 May 2023 by Kam, C. Y., Singh, I. D., et al.
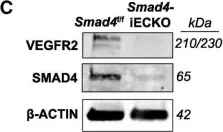
A functional network of blood vessels is essential for organ growth and homeostasis, yet how the vasculature matures and maintains homeostasis remains elusive in live mice. By longitudinally tracking the same neonatal endothelial cells (ECs) over days to weeks, we found that capillary plexus expansion is driven by vessel regression to optimize network perfusion. Neonatal ECs rearrange positions to evenly distribute throughout the developing plexus and become positionally stable in adulthood. Upon local ablation, adult ECs survive through a plasmalemmal self-repair response, while neonatal ECs are predisposed to die. Furthermore, adult ECs reactivate migration to assist vessel repair. Global ablation reveals coordinated maintenance of the adult vascular architecture that allows for eventual network recovery. Lastly, neonatal remodeling and adult maintenance of the skin vascular plexus are orchestrated by temporally restricted, neonatal VEGFR2 signaling. Our work sheds light on fundamental mechanisms that underlie both vascular maturation and adult homeostasis in vivo.
Copyright © 2023 Elsevier Inc. All rights reserved.
-
Mus musculus (House mouse)
Preprint on BioRxiv : the Preprint Server for Biology on 3 November 2022 by Kam, C. Y., Singh, I. D., et al.
ABSTRACT A functional network of blood vessels is essential for organ growth and homeostasis. Yet, how the vasculature matures and maintains adult homeostasis remains elusive in live mice. By longitudinally tracking the same neonatal endothelial cells (ECs) over days to weeks, we found that capillary plexus expansion is driven by network-wide vessel regression and transient angiogenesis. A fixed number of neonatal ECs rearrange their positions to evenly distribute throughout the developing plexus and become positionally stable in adulthood. Upon injury, while neonatal ECs are predisposed to die, adult ECs survive through a plasmalemmal self-repair response. Furthermore, adult neighboring ECs reactivate migration to assist vessel repair. Lastly, neonatal vessel regression and adult vascular maintenance are orchestrated by temporally restricted VEGFR2 dependent signaling. Our work sheds light on fundamental cellular mechanisms that underlie both vascular maturation and adult homeostasis in vivo .
In JCI Insight on 8 March 2024 by Zhao, Y., Yang, Y., et al.
Fig.3.D

-
WB
-
Mus musculus (House mouse)
Collected and cropped from JCI Insight by CiteAb, provided under a CC-BY license
Image 1 of 4
In JCI Insight on 8 March 2024 by Zhao, Y., Yang, Y., et al.
Fig.5.E

-
WB
-
Mus musculus (House mouse)
Collected and cropped from JCI Insight by CiteAb, provided under a CC-BY license
Image 1 of 4
In JCI Insight on 8 March 2024 by Zhao, Y., Yang, Y., et al.
Fig.6.C

-
WB
-
Mus musculus (House mouse)
Collected and cropped from JCI Insight by CiteAb, provided under a CC-BY license
Image 1 of 4
In Angiogenesis on 1 May 2018 by Crist, A. M., Lee, A. R., et al.
Fig.6.C

-
WB
-
Mus musculus (House mouse)
Collected and cropped from Angiogenesis by CiteAb, provided under a CC-BY license
Image 1 of 4