
Extracellular vesicles (EVs) have been proven to have a crucial role in intercellular communication and have attracted significant attention in the physiology of reproduction because of their multiple functions in physiological processes essential for reproduction including gametogenesis, fertilization and embryo-endometrial cross-talk. Although EVs from the male reproductive tract have been extensively studied for their role in sperm maturation, research on female reproductive tract-derived EVs in humans is still emerging and supported by only a few studies to date. In vitro study was performed using spermatozoa from normozoospermic men and EVs isolated from follicular fluid (FF-EVs), cervicovaginal fluid collected 2 and 7 days after the LH surge (CVF-EVs LH + 2 and LH + 7, respectively) and spent medium of decidualized (dESCs-EVs) and non-decidualized (eESCs-EVs) endometrial stromal cells from healthy women of reproductive age. The principal outcome measures comprise the percentage of viable, progressively motile, and capacitated spermatozoa after treatment with FF-EVs, CVF-EVs LH + 2 and LH + 7, dESCs-EVs, and eESCs-EVs. Spermatozoa are able to capture EVs derived from all the considered tracts of the female reproductive system, with slightly varying efficiencies, albeit comparable in most cases. Incubating sperm cells with any of these EVs does not have any detrimental effect on sperm vitality, increases the percentage of spermatozoa displaying progressive motility and the percentage of acrosome-reacted spermatozoa. EVs produced and released in various regions of the female reproductive system likely contribute to spermatozoa maturation during their transit, promoting both capacitation and motility.
© 2025. The Author(s).
Product Citations: 84
In Scientific Reports on 17 July 2025 by Fasoli, C., Giacomini, E., et al.
Extracellular vesicles adhere to cells primarily by interactions of integrins and GM1 with laminin.
In The Journal of Cell Biology on 2 June 2025 by Isogai, T., Hirosawa, K. M., et al.
Tumor-derived extracellular vesicles (EVs) have attracted significant attention, yet the molecular mechanisms that govern their specific binding to recipient cells remain elusive. Our in vitro study utilizing single-particle tracking demonstrated that integrin heterodimers comprising α6β4 and α6β1 and ganglioside, GM1, are responsible for the binding of small EV (sEV) subtypes to laminin. EVs derived from four distinct tumor cell lines, regardless of size, exhibited high binding affinities for laminin but not for fibronectin, although fibronectin receptors are abundant in EVs and have functional roles in EV-secreting cells. Our findings revealed that integrins in EVs bind to laminin via the conventional molecular interface, facilitated by CD151 rather than by inside-out signaling of talin-1 and kindlin-2. Super-resolution movie observation revealed that sEV integrins bind only to laminin on living recipient cells. Furthermore, sEVs bound to HUVEC and induced cell branching morphogenesis in a laminin-dependent manner. Thus, we demonstrated that EVs predominantly bind to laminin on recipient cells, which is indispensable for cell responses.
© 2025 Isogai et al.
-
Cell Biology
In Journal of Extracellular Vesicles on 1 March 2025 by Su, B., Jeyhani, M., et al.
The isolation of extracellular vesicles (EVs) using currently available methods frequently compromises purity and yield to prioritize speed. Here, we present a next-generation aqueous two-phase system (next-gen ATPS) for the isolation of EVs regardless of scale and volume that is superior to conventional methods such as ultracentrifugation (UC) and commercial kits. This is made possible by the two aqueous phases, one rich in polyethylene glycol (PEG) and the other rich in dextran (DEX), whereby fully encapsulated lipid vesicles preferentially migrate to the DEX-rich phase to achieve a local energy minimum for the EVs. Isolated EVs as found in the DEX-rich phase are more amenable to biomarker analysis such as nanoscale flow cytometry (nFC) when using various pre-conjugated antibodies specific for CD9, CD63 and CD81. TRIzol RNA isolation is further enabled by the addition of dextranase, a critical component of this next-gen ATPS method. RNA yield of next-gen ATPS-isolated EVs is superior to UC and other commercial kits. This negates the use of specialized EV RNA extraction kits. The use of dextranase also enables more accurate immunoreactivity of pre-conjugated antibodies for the detection of EVs by nFC. Transcriptomic analysis of EVs isolated using the next-gen ATPS revealed a strong overlap in microRNA (miRNA), circular RNA (circRNA) and small nucleolar RNA (snoRNA) profiles with EV donor cells, as well as EVs isolated by UC and the exoRNeasy kit, while detecting a superior number of circRNAs compared to the kit in human samples. Overall, this next-gen ATPS method stands out as a rapid and highly effective approach to isolate high-quality EVs in high yield, ensuring optimal extraction and analysis of EV-encapsulated nucleic acids.
© 2025 The Author(s). Journal of Extracellular Vesicles published by Wiley Periodicals LLC on behalf of International Society for Extracellular Vesicles.
-
WB
In Science Advances on 3 January 2025 by Choi, Y., Park, J. H., et al.
The early detection of neurodegenerative diseases necessitates the identification of specific brain-derived biomolecules in peripheral blood. In this context, our investigation delineates the role of amyloid precursor-like protein 1 (APLP1)-a protein predominantly localized in oligodendrocytes and neurons-as a previously unidentified biomarker in extracellular vesicles (EVs). Through rigorous analysis, APLP1+ EVs from human sera were unequivocally determined to be of cerebral origin. This assertion was corroborated by distinctive small RNA expression patterns of APLP1+ EVs. The miRNAs' putative targets within these EVs manifested pronounced expression in the brain, fortifying their neurospecific provenance. We subjected our findings to stringent validation using Thy-1 GFP M line mice, transgenic models wherein GFP expression is confined to hippocampal neurons. An amalgamation of these results with an exhaustive data analysis accentuates the potential of APLP1+ EVs as cerebrally originated biomarkers. Synthesizing our findings, APLP1+ EVs are postulated not merely as diagnostic markers but as seminal entities shaping the future trajectory of neurodegenerative disease diagnostics.
-
Cardiovascular biology
In International Journal of Biological Sciences on 12 December 2024 by Barilani, M., Peli, V., et al.
Extracellular vesicles (EV) have emerged as promising cell-free therapeutics in regenerative medicine. However, translating primary cell line-derived EV to clinical applications requires large-scale manufacturing and several challenges, such as replicative senescence, donor heterogeneity, and genetic instability. To address these limitations, we used a reprogramming approach to generate human induced pluripotent stem cells (hiPSC) from the young source of cord blood mesenchymal stem/stromal cells (CBMSC). Capitalizing on their inexhaustible supply potential, hiPSC offer an attractive EV reservoir. Our approach encompassed an exhaustive characterization of hiPSC-EV, aligning with the rigorous MISEV2023 guidelines. Analyses demonstrated physical features compatible with small EV (sEV) and established their identity and purity. Moreover, the sEV-shuttled non-coding (nc) RNA landscape, focusing on the microRNA and circular RNA cargo, completed the molecular signature. The kinetics of the hiPSC-sEV release and cell internalization assays unveiled robust EV production and consistent uptake by human neurons. Furthermore, hiPSC-sEV demonstrated ex vivo cell tissue-protective properties. Finally, via bioinformatics, the potential involvement of the ncRNA cargo in the hiPSC-sEV biological effects was explored. This study significantly advances the understanding of pluripotent stem cell-derived EV. We propose cord blood MSC-derived hiPSC as a promising source for potentially therapeutic sEV.
© The author(s).
-
Stem Cells and Developmental Biology
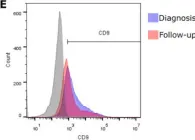
In Pharmaceuticals (Basel) on 16 November 2023 by Gardani, C. F. F., Pedrazza, E. L., et al.
Fig.2.E

-
FC/FACS
-
Homo sapiens (Human)
Collected and cropped from Pharmaceuticals (Basel) by CiteAb, provided under a CC-BY license
Image 1 of 7
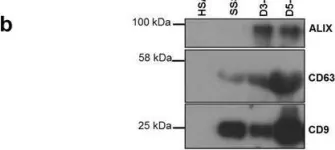
In Int J Mol Sci on 5 May 2023 by Arcuri, S., Pennarossa, G., et al.
Fig.7.B

-
WB
-
Collected and cropped from Int J Mol Sci by CiteAb, provided under a CC-BY license
Image 1 of 7
In Front Microbiol on 17 November 2020 by Urquiza, J., Cevallos, C., et al.
Fig.2.C

-
WB
-
Collected and cropped from Front Microbiol by CiteAb, provided under a CC-BY license
Image 1 of 7
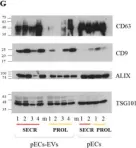
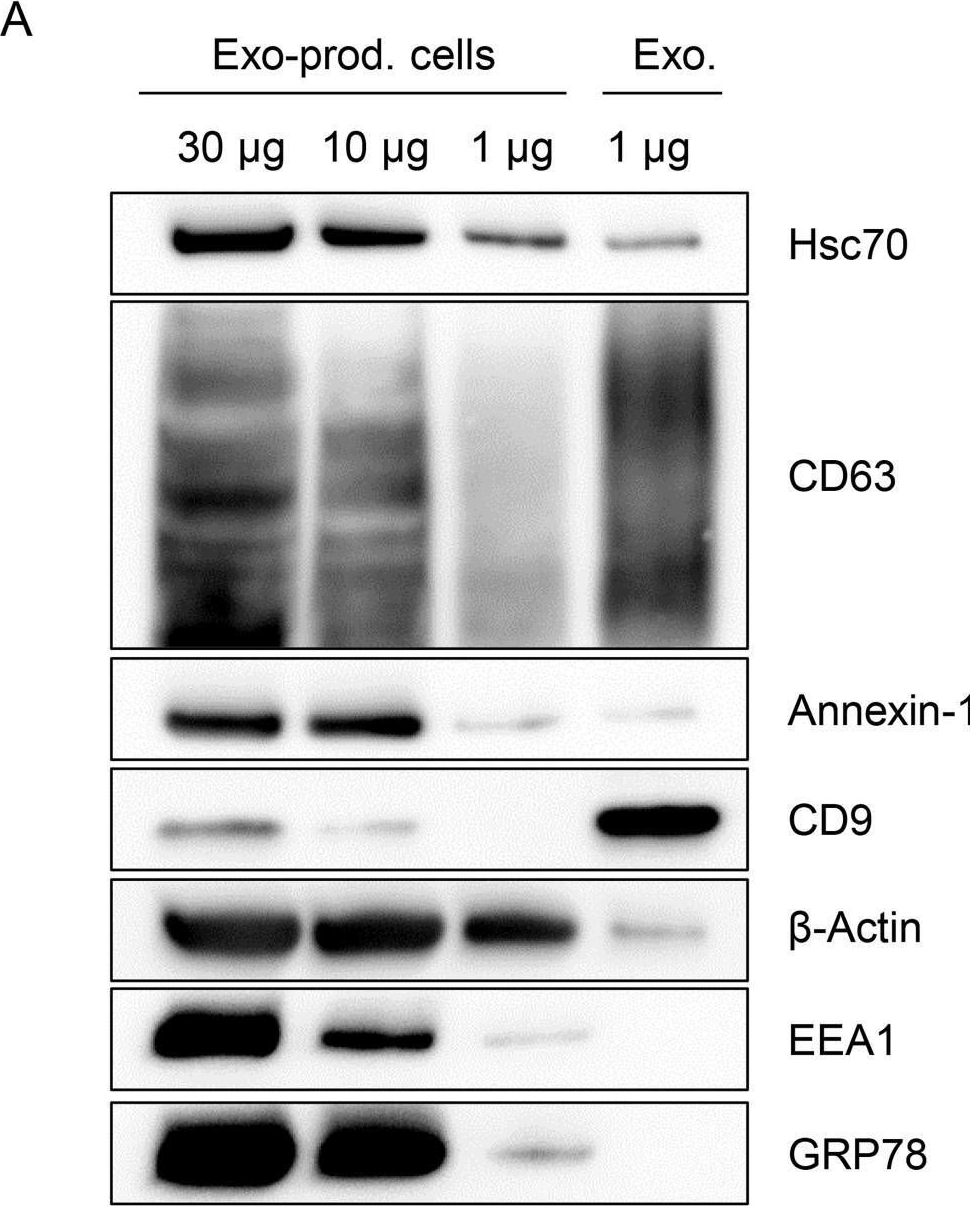
In Sci Rep on 1 June 2020 by Murdica, V., Giacomini, E., et al.
Fig.1.G

-
WB
-
Collected and cropped from Sci Rep by CiteAb, provided under a CC-BY license
Image 1 of 7
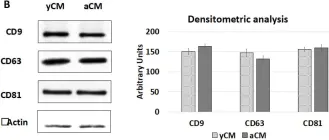
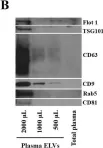
In Sci Rep on 12 July 2017 by Giacomini, E., Vago, R., et al.
Fig.2.B

-
WB
-
Homo sapiens (Human)
Collected and cropped from Sci Rep by CiteAb, provided under a CC-BY license
Image 1 of 7
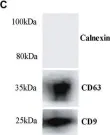
In PLoS One on 15 March 2016 by Altadill, T., Campoy, I., et al.
Fig.1.B

-
WB
-
Collected and cropped from PLoS One by CiteAb, provided under a CC-BY license
Image 1 of 7
In PLoS Pathog on 1 March 2015 by Honegger, A., Schilling, D., et al.
Fig.7.A
-
WB
-
Collected and cropped from PLoS Pathog by CiteAb, provided under a CC-BY license
Image 1 of 7