To identify genomic regions subject to positive selection that might contain genes involved in high-altitude adaptation (HAA), we performed a genome-wide scan by whole-genome sequencing of Tibetan highlanders and Han lowlanders. We revealed a collection of candidate genes located in 30 genomic loci under positive selection. Among them, MCUR1 at 6p23 was a novel pronounced candidate. By single-cell RNA sequencing and comprehensive functional studies, we demonstrated that MCUR1 depletion leads to impairment of erythropoiesis under hypoxia and normoxia. Mechanistically, MCUR1 knockdown reduced mitochondrial Ca2+ uptake and then concomitantly increased cytosolic Ca2+ levels, which thereby reduced erythropoiesis via the CAMKK2-AMPK-mTOR axis. Further, we revealed rs61644582 at 6p23 as an expression quantitative trait locus for MCUR1 and a functional variant that confers an allele-specific transcriptional regulation of MCUR1. Overall, MCUR1-mediated mitochondrial Ca2+ homeostasis is highlighted as a novel regulator of erythropoiesis, deepening our understanding of the genetic mechanism of HAA.
Copyright © 2025 The Author(s). Published by Elsevier Inc. All rights reserved.
Product Citations: 19
In Cell Genom on 12 March 2025 by Ping, J., Liu, X., et al.
-
Biochemistry and Molecular biology
In Cancer Discovery on 6 September 2023 by Pei, S., Shelton, I. T., et al.
The BCL2 inhibitor venetoclax has recently emerged as an important component of acute myeloid leukemia (AML) therapy. Notably, use of this agent has revealed a previously unrecognized form of pathogenesis characterized by monocytic disease progression. We demonstrate that this form of disease arises from a fundamentally different type of leukemia stem cell (LSC), which we designate as monocytic LSC (m-LSC), that is developmentally and clinically distinct from the more well-described primitive LSC (p-LSC). The m-LSC is distinguished by a unique immunophenotype (CD34-, CD4+, CD11b-, CD14-, CD36-), unique transcriptional state, reliance on purine metabolism, and selective sensitivity to cladribine. Critically, in some instances, m-LSC and p-LSC subtypes can co-reside in the same patient with AML and simultaneously contribute to overall tumor biology. Thus, our findings demonstrate that LSC heterogeneity has direct clinical significance and highlight the need to distinguish and target m-LSCs as a means to improve clinical outcomes with venetoclax-based regimens.
These studies identify and characterize a new type of human acute myeloid LSC that is responsible for monocytic disease progression in patients with AML treated with venetoclax-based regimens. Our studies describe the phenotype, molecular properties, and drug sensitivities of this unique LSC subclass. This article is featured in Selected Articles from This Issue, p. 1949.
©2023 American Association for Cancer Research.
-
Cancer Research
-
Stem Cells and Developmental Biology
In eLife on 12 April 2023 by Hiddingh, S., Pandit, A., et al.
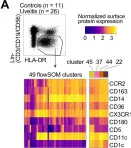
Type I interferons (IFNs) promote the expansion of subsets of CD1c+ conventional dendritic cells (CD1c+ DCs), but the molecular basis of CD1c+ DCs involvement in conditions not associated without elevated type I IFNs remains unclear.
We analyzed CD1c+ DCs from two cohorts of non-infectious uveitis patients and healthy donors using RNA-sequencing followed by high-dimensional flow cytometry to characterize the CD1c+ DC populations.
We report that the CD1c+ DCs pool from patients with non-infectious uveitis is skewed toward a gene module with the chemokine receptor CX3CR1 as the key hub gene. We confirmed these results in an independent case-control cohort and show that the disease-associated gene module is not mediated by type I IFNs. An analysis of peripheral blood using flow cytometry revealed that CX3CR1+ DC3s were diminished, whereas CX3CR1- DC3s were not. Stimulated CX3CR1+ DC3s secrete high levels of inflammatory cytokines, including TNF-alpha, and CX3CR1+ DC3 like cells can be detected in inflamed eyes of patients.
These results show that CX3CR1+ DC3s are implicated in non-infectious uveitis and can secrete proinflammatory mediators implicated in its pathophysiology.
The presented work is supported by UitZicht (project number #2014-4, #2019-10, and #2021-4). The funders had no role in the design, execution, interpretation, or writing of the study.
© 2023, Hiddingh, Pandit, Verhagen et al.
-
FC/FACS
-
Immunology and Microbiology
In BMC Medicine on 1 November 2022 by Piñeiro-Salvador, R., Vázquez-Garza, E., et al.
Breastmilk is a dynamic fluid whose initial function is to provide the most adapted nutrition to the neonate. Additional attributes have been recently ascribed to breastmilk, with the evidence of a specific microbiota and the presence of various components of the immune system, such as cytokines and leukocytes. The composition of breastmilk varies through time, according to the health status of mother and child, and altogether contributes to the future health of the infant. Obesity is a rising condition worldwide that creates a state of systemic, chronic inflammation including leukocytosis. Here, we asked whether colostrum, the milk produced within the first 48 h post-partum, would contain a distinct leukocyte composition depending on the body mass index (BMI) of the mother.
We collected peripheral blood and colostrum paired samples from obese (BMI > 30) and lean (BMI < 25) mothers within 48 h post-partum and applied a panel of 6 antibodies plus a viability marker to characterize 10 major leukocyte subpopulations using flow cytometry.
The size, internal complexity, and surface expression of CD45 and CD16 of multiple leukocyte subpopulations were selectively regulated between blood and colostrum irrespective of the study groups, suggesting a generalized cell-specific phenotype alteration. In obesity, the colostrum B lymphocyte compartment was significantly reduced, and CD16+ blood monocytes had an increased CD16 expression compared to the lean group.
This is the first characterization of major leukocyte subsets in colostrum of mothers suffering from obesity and the first report of colostrum leukocyte subpopulations in Latin America. We evidence various significant alterations of most leukocyte populations between blood and colostrum and demonstrate a decreased colostrum B lymphocyte fraction in obesity. This pioneering study is a stepping stone to further investigate active immunity in human breastmilk.
© 2022. The Author(s).
-
Homo sapiens (Human)
In The Journal of Biological Chemistry on 1 July 2022 by Saitoski, K., Ryaboshapkina, M., et al.
Proprotein convertase subtilisin/kexin type 9 (PCSK9) is involved in the degradation of the low-density lipoprotein receptor. PCSK9 also targets proteins involved in lipid metabolism (very low-density lipoprotein receptor), immunity (major histocompatibility complex I), and viral infection (cluster of differentiation 81). Recent studies have also indicated that PCSK9 loss-of-function mutations are associated with an increased incidence of diabetes; however, the expression and function of PCSK9 in insulin-producing pancreatic beta cells remain unclear. Here, we studied PCSK9 regulation and function by performing loss- and gain-of-function experiments in the human beta cell line EndoC-βH1. We demonstrate that PCSK9 is expressed and secreted by EndoC-βH1 cells. We also found that PCSK9 expression is regulated by cholesterol and sterol regulatory element-binding protein transcription factors, as previously demonstrated in other cell types such as hepatocytes. Importantly, we show that PCSK9 knockdown using siRNA results in deregulation of various elements of the transcriptome, proteome, and secretome, and increases insulin secretion. We also observed that PCSK9 decreases low-density lipoprotein receptor and very low-density lipoprotein receptor levels via an extracellular signaling mechanism involving exogenous PCSK9, as well as levels of cluster of differentiation 36, a fatty acid transporter, through an intracellular signaling mechanism. Finally, we found that PCSK9 regulates the cell surface expression of PDL1 and HLA-ABC, proteins involved in cell-lymphocyte interaction, also via an intracellular mechanism. Collectively, these results highlight PCSK9 as a regulator of multiple cell surface receptors in pancreatic beta cells.
Copyright © 2022 The Authors. Published by Elsevier Inc. All rights reserved.
-
FC/FACS
-
Homo sapiens (Human)
-
Biochemistry and Molecular biology
In Elife on 12 April 2023 by Hiddingh, S., Pandit, A., et al.
Fig.3.A

-
FC/FACS
-
Collected and cropped from Elife by CiteAb, provided under a CC-BY license
Image 1 of 1