Vacuolar protein sorting 41 (VPS41), a component of the homotypic fusion and protein sorting (HOPS) complex for lysosomal fusion, is essential for the trafficking of lysosomal membrane proteins via lysosome-associated membrane protein (LAMP) carriers from the trans-Golgi network (TGN) to endo/lysosomes. However, the molecular mechanisms underlying this pathway and VPS41's role herein remain poorly understood. Here, we investigated the effects of ectopically localizing VPS41 to mitochondria on LAMP distribution. Using electron microscopy, we identified that mitochondrial-localized VPS41 recruited LAMP1- and LAMP2A-positive vesicles resembling LAMP carriers. The retention using selective hooks (RUSH) system further revealed that newly synthesized LAMPs were specifically recruited by mitochondrial VPS41, a function not shared by other HOPS subunits. Notably, we identified the small GTPase Arl8b as a critical factor for LAMP carrier trafficking. Arl8b was present on LAMP carriers and bound to the WD40 domain of VPS41, enabling their recruitment. These findings reveal a unique role of VPS41 in recruiting TGN-derived LAMP carriers and expand our understanding of VPS41-Arl8b interactions beyond endosome-lysosome fusion, providing new insights into lysosomal trafficking mechanisms.
© 2025 Sanzà et al.
Product Citations: 241
VPS41 recruits biosynthetic LAMP-positive vesicles through interaction with Arl8b.
In The Journal of Cell Biology on 3 April 2025 by Sanzà, P., van der Beek, J., et al.
-
Cell Biology
Neutrophil extracellular traps promote tumor chemoresistance to anthracyclines
Preprint on BioRxiv : the Preprint Server for Biology on 11 November 2024 by Lin, C., Herlihy, S. E., et al.
The microenvironment plays an important role in promoting tumor cell chemoresistance, but the mechanisms responsible for this effect are not clear. Here, using models of multiple myeloma (MM) and solid cancers, we demonstrate a novel mechanism mediated by neutrophils, a major cell population in the bone marrow (BM), that protects cancer cells from chemotherapeutics. We show that in response to tumor-derived soluble factors, BM neutrophils release their DNA in the form of neutrophil extracellular traps (NETs). Cell-free DNA derived from NETs is then taken up by tumor cells via endocytosis and localizes to the cytoplasm. We found that both NETs and cell-free DNA taken up by tumor cells can bind anthracyclines, leading to tumor cell resistance to this class of chemotherapeutic agents. Targeting cell-free DNA with Pulmozyme or blocking NET formation with a PAD4 inhibitor abrogates the chemoprotective effect of neutrophils and restores sensitivity of tumor cells to anthracyclines.
-
Cancer Research
In Cells on 4 November 2024 by Ferraresi, A., Ghezzi, I., et al.
Several soluble factors secreted by the stromal cells and cancer cells within the tumor microenvironment facilitate the progression and invasiveness of ovarian cancer. In ovarian cancer cells, lysophosphatidic acid (LPA) modulates the transcriptome profile and promotes cell invasiveness by the downregulation of autophagy. Here, we further elucidate this mechanism by focusing on the molecular and cellular events regulating autophagy. Transcriptomic and Western blotting analyses revealed NKX3-2, a transcriptional factor, to be among the genes hyperexpressed in LPA-stimulated ovarian cancer cells. Bioinformatic analyses revealed that in ovarian cancer patients, the expression of NKX3-2 positively correlates with genes involved in cell motility and migration, while it negatively correlates with macromolecular catabolic pathways. In various ovarian cancer cell lines, NKX3-2 silencing abrogated LPA-induced cell migration. Mechanistically, this effect is linked to the restoration of the HDAC6-mediated relocation of the lysosomes in the para-golgian area, and this results in an increase in autolysosome formation and the overall upregulation of autophagy. Silencing the expression of ATG7 or BECN1, two autophagy genes, rescued the migratory phenotype of the NKX3-2-silenced ovarian cancer cells. Taken together, these data reveal the mechanism by which the LPA-NKX3-2 axis promotes the invasiveness of ovarian cancer cells and supports the possibility of targeting NKX3-2 to reduce the migratory capacity of cancer cells in response to a permissive microenvironment.
-
Homo sapiens (Human)
-
Cancer Research
-
Cell Biology
Migfilin promotes autophagic flux through direct interaction with SNAP29 and Vamp8.
In The Journal of Cell Biology on 4 November 2024 by Cai, R., Bai, P., et al.
Autophagy plays a crucial role in cancer cell survival by facilitating the elimination of detrimental cellular components and the recycling of nutrients. Understanding the molecular regulation of autophagy is critical for developing interventional approaches for cancer therapy. In this study, we report that migfilin, a focal adhesion protein, plays a novel role in promoting autophagy by increasing autophagosome-lysosome fusion. We found that migfilin is associated with SNAP29 and Vamp8, thereby facilitating Stx17-SNAP29-Vamp8 SNARE complex assembly. Depletion of migfilin disrupted the formation of the SNAP29-mediated SNARE complex, which consequently blocked the autophagosome-lysosome fusion, ultimately suppressing cancer cell growth. Restoration of the SNARE complex formation rescued migfilin-deficiency-induced autophagic flux defects. Finally, we found depletion of migfilin inhibited cancer cell proliferation. SNARE complex reassembly successfully reversed migfilin-deficiency-induced inhibition of cancer cell growth. Taken together, our study uncovers a new function of migfilin as an autophagy-regulatory protein and suggests that targeting the migfilin-SNARE assembly could provide a promising therapeutic approach to alleviate cancer progression.
This is a work of the U.S. Government and is not subject to copyright protection in the United States. Foreign copyrights may apply.
-
Cell Biology
IER3IP1-mutations cause microcephaly by selective inhibition of ER-Golgi transport.
In Cellular and Molecular Life Sciences : CMLS on 8 August 2024 by Anitei, M., Bruno, F., et al.
Mutations in the IER3IP1 (Immediate Early Response-3 Interacting Protein 1) gene can give rise to MEDS1 (Microcephaly with Simplified Gyral Pattern, Epilepsy, and Permanent Neonatal Diabetes Syndrome-1), a severe condition leading to early childhood mortality. The small endoplasmic reticulum (ER)-membrane protein IER3IP1 plays a non-essential role in ER-Golgi transport. Here, we employed secretome and cell-surface proteomics to demonstrate that the absence of IER3IP1 results in the mistrafficking of proteins crucial for neuronal development and survival, including FGFR3, UNC5B and SEMA4D. This phenomenon correlates with the distension of ER membranes and increased lysosomal activity. Notably, the trafficking of cargo receptor ERGIC53 and KDEL-receptor 2 are compromised, with the latter leading to the anomalous secretion of ER-localized chaperones. Our investigation extended to in-utero knock-down of Ier3ip1 in mouse embryo brains, revealing a morphological phenotype in newborn neurons. In summary, our findings provide insights into how the loss or mutation of a 10 kDa small ER-membrane protein can cause a fatal syndrome.
© 2024. The Author(s).
-
Biochemistry and Molecular biology
-
Cell Biology
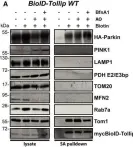
In EMBO J on 2 June 2020 by Ryan, T. A., Phillips, E. O., et al.
Fig.3.A

-
WB
-
Collected and cropped from EMBO J by CiteAb, provided under a CC-BY license
Image 1 of 4
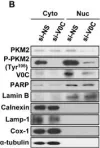
In Cells on 24 September 2019 by Son, S. W., Chau, G. C., et al.
Fig.5.B

-
WB
-
Homo sapiens (Human)
Collected and cropped from Cells by CiteAb, provided under a CC-BY license
Image 1 of 4
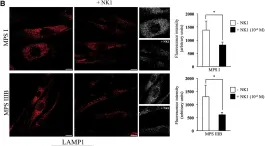
In Mol Ther Methods Clin Dev on 21 September 2018 by De Pasquale, V., Sarogni, P., et al.
Fig.2.B

-
ICC-IF
-
Collected and cropped from Mol Ther Methods Clin Dev by CiteAb, provided under a CC-BY license
Image 1 of 4
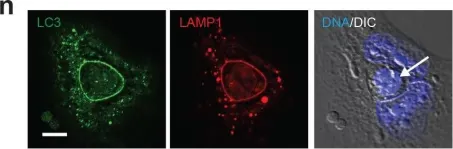
In Elife on 11 July 2017 by Durgan, J., Tseng, Y. Y., et al.
Fig.1.N

-
ICC
-
Homo sapiens (Human)
Collected and cropped from Elife by CiteAb, provided under a CC-BY license
Image 1 of 4