
Deciphering the origins of innate lymphoid cells (ILCs) is critical for a deeper understanding of innate immunity. Here, we present a protocol for assessing ILC potential of human embryonic resources. We describe steps for identifying lymphoid progenitors in human embryonic tissues, then culturing mature ILCs in vitro, and identifying characteristics and functions of different cultured ILC subsets using cellular indexing of transcriptomes and epitopes (CITE)-sequencing and flow cytometry analysis. This protocol provides a simple platform for investigating the development of human embryonic ILCs. For complete details on the use and execution of this protocol, please refer to Ni et al.1.
Copyright © 2024 The Author(s). Published by Elsevier Inc. All rights reserved.
Product Citations: 198
Protocol for in vitro generation of innate lymphoid cells from human embryonic tissues.
In STAR Protocols on 21 March 2025 by Liu, C., Fu, Q., et al.
-
Stem Cells and Developmental Biology
In International Journal of Nanomedicine on 13 January 2025 by Tan, L., Zhang, C., et al.
Acute respiratory distress syndrome (ARDS) is a life-threatening type of acute lung injury (ALI) characterized by elevated mortality rates and long-term effects. To date, no pharmacological treatment has proven effective for ARDS. Mesenchymal stem cell-derived apoptotic vesicles (apoVs) were recently found to have excellent therapeutic potential for inflammatory diseases. In this study, our aim was to investigate the therapeutic effects and underlying mechanisms of apoVs in ALI.
ALI was induced in mice through intratracheal instillation of lipopolysaccharide (LPS). ApoVs were then administered two hours post-induction, and their impacts on platelet activation, neutrophil infiltration, and NETosis were assessed. Additionally, the role of CD73 in mediating these effects was thoroughly investigated.
ApoVs inhibit platelet activation, thereby impeding the infiltration of neutrophils into the lung and the initiation of NETosis, ultimately alleviating ALI. Remarkably, apoVs were enriched with CD73, which was critical for apoV-mediated repression of platelet activation and neutrophil NETosis, as well as the therapeutic effects observed in lung injury.
This study reveals that apoVs inhibit platelet activity and neutrophil NETosis via CD73, offering an innovative and effective cell-free therapeutic strategy for ALI/ARDS.
© 2025 Tan et al.
Identification of human cranio-maxillofacial skeletal stem cells for mandibular development.
In Science Advances on 3 January 2025 by Wang, Z., Wang, K., et al.
Compared with long bone that arises from the mesoderm, the major portion of the maxillofacial bones and the front bone of the skull are derived from cranial neural crest cells and undergo intramembranous ossification. Human skeletal stem cells have been identified in embryonic and fetal long bones. Here, we describe a single-cell atlas of the human embryonic mandible and identify a population of cranio-maxillofacial skeletal stem cells (CMSSCs). These CMSSCs are marked by interferon-induced transmembrane protein 5 (IFITM5) and are specifically located around the periosteum of the jawbone and frontal bone. Additionally, these CMSSCs exhibit strong self-renewal and osteogenic differentiation capacities but lower chondrogenic differentiation potency, mediating intramembranous bone formation without cartilage formation. IFITM5+ cells are also observed in the adult jawbone and exhibit functions similar to those of embryonic CMSSCs. Thus, this study identifies CMSSCs that orchestrate the intramembranous ossification of cranio-maxillofacial bones, providing a deeper understanding of cranio-maxillofacial skeletal development and promising seed cells for bone repair.
-
Stem Cells and Developmental Biology
Fetal hepatocytes protect the HSPC genome via fetuin-A.
In Nature on 1 January 2025 by Guo, X. L., Wang, Y. D., et al.
The maintenance of genomic integrity in rapidly proliferating cells is a substantial challenge during embryonic development1-3. Although numerous cell-intrinsic mechanisms have been revealed4-7, little is known about genome-protective effects and influences of developmental tissue microenvironments on tissue-forming cells. Here we show that fetal liver hepatocytes provide protection to haematopoietic stem and progenitor cell (HSPC) genomes. Lineage tracing and depletion in mice demonstrated that delayed hepatocyte development in early fetal livers increased the chromosomal instability of newly colonizing HSPCs. In addition, HSPCs developed tolerance to genotoxins in hepatocyte-conditioned medium, suggesting that hepatocytes protect the HSPC genome in a paracrine manner. Proteomic analyses demonstrated the enrichment of fetuin-A in hepatocyte-conditioned medium but not in early fetal livers. Fetuin-A activates a Toll-like receptor pathway to prevent pathogenic R-loop accumulation in HSPCs undergoing DNA replication and gene transcription in the fetal liver. Numerous haematopoietic regulatory genes frequently involved in leukaemogenic mutations are associated with R-loop-enriched regions. In Fetua-knockout mice, HSPCs showed increased genome instability and susceptibility to malignancy induction. Moreover, low concentrations of fetuin-A correlated with the oncogenesis of childhood leukaemia. Therefore, we uncover a mechanism operating in developmental tissues that offers tissue-forming cell genome protection and is implicated in developmental-related diseases.
© 2024. The Author(s).
In STAR Protocols on 20 September 2024 by Li, Z., Ma, R., et al.
Type 2 innate lymphoid cells (ILC2s) are crucial in regulating immune responses and various physiological processes, including tissue repair, metabolic homeostasis, inflammation, and cancer surveillance. Here, we present a protocol that outlines the isolation, expansion, and adoptive transfer of human ILC2s from peripheral blood mononuclear cells for an in vivo lineage tracking experiment in a mouse model. Additionally, we detail the steps involved in the adoptive transfer of human ILC2s to recipient mice bearing human liquid or solid tumors. For complete details on the use and execution of this protocol, please refer to Li et al.1.
Copyright © 2024. Published by Elsevier Inc.
-
Homo sapiens (Human)
-
Cancer Research
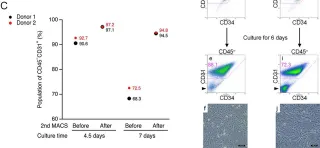
In Sci Rep on 2 February 2022 by Saito, N., Shirado, T., et al.
Fig.3.C

-
FC/FACS
-
Homo sapiens (Human)
Collected and cropped from Sci Rep by CiteAb, provided under a CC-BY license
Image 1 of 4
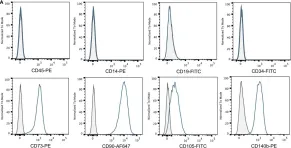
In Front Immunol on 17 May 2018 by Bastian, O. W., Croes, M., et al.
Fig.1.A

-
FC/FACS
-
Homo sapiens (Human)
Collected and cropped from Front Immunol by CiteAb, provided under a CC-BY license
Image 1 of 4
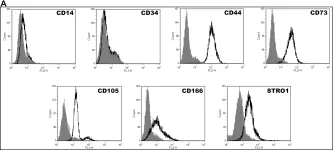
In Stem Cell Res Ther on 4 December 2014 by Wang, Y., Wu, H., et al.
Fig.2.D
-
FC/FACS
-
Homo sapiens (Human)
Collected and cropped from Stem Cell Res Ther by CiteAb, provided under a CC-BY license
Image 1 of 4
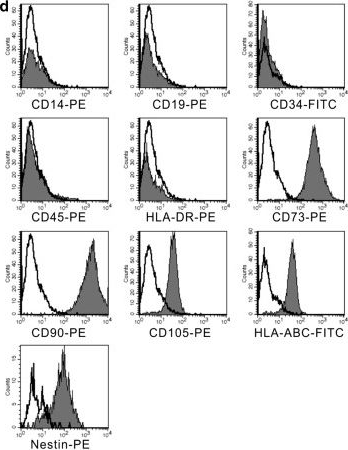
In PLoS One on 30 August 2014 by Tsai, H. L., Deng, W. P., et al.
Fig.1.A

-
FC/FACS
-
Homo sapiens (Human)
Collected and cropped from PLoS One by CiteAb, provided under a CC-BY license
Image 1 of 4