3D tumoroids have revolutionized in vitro/ex vivo cancer biology by recapitulating the complex diversity of tumors. While tumoroids provide new insights into cancer development and treatment response, several limitations remain. As the tumor microenvironment, especially the immune system, strongly influences tumor development, the absence of immune cells in tumoroids may lead to inappropriate conclusions. Macrophages, key players in tumor progression, are particularly challenging to integrate into the tumoroids. In this study, we established three optimized and standardized methods for co-culturing human macrophages with breast cancer tumoroids: a semi-liquid model and two matrix-embedded models tailored for specific applications. We then tracked interactions and macrophage infiltration in these systems using flow cytometry and light sheet microscopy and showed that macrophages influenced not only tumoroid molecular profiles but also chemotherapy response. This underscores the importance of increasing the complexity of 3D models to more accurately reflect in vivo conditions.
Copyright © 2024 The Authors. Published by Elsevier Inc. All rights reserved.
Product Citations: 42
In Cell Rep Methods on 17 June 2024 by Raffo-Romero, A., Ziane-Chaouche, L., et al.
-
Homo sapiens (Human)
-
Cancer Research
In Urolithiasis on 30 March 2024 by Okada, T., Okada, A., et al.
Macrophages play a role in nephrolithiasis, offering the possibility of developing macrophage-mediated preventive therapies. To establish a system for screening drugs that could prevent the formation of kidney stones, we aimed to develop a model using human induced pluripotent stem cell (iPSC)-derived macrophages to study phagocytosis of calcium oxalate monohydrate (COM) crystals. Human iPSCs (201B7) were cultured. CD14+ monocytes were recovered using a stepwise process that involved the use of growth factors and cytokines. These cells were then allowed to differentiate into M1 and M2 macrophages. The macrophages were co-cultured with COM crystals and used in the phagocytosis experiments. Live cell imaging and polarized light observation via super-resolution microscopy were used to visualize phagocytosis. Localization of phagocytosed COM crystals was observed using transmission electron microscopy. Intracellular fluorescence intensity was measured using imaging cytometry to quantify phagocytosis. Human iPSCs successfully differentiated into M1 and M2 macrophages. M1 macrophages adhered to the culture plate and moved COM crystals from the periphery to cell center over time, whereas M2 macrophages did not adhere to the culture plate and actively phagocytosed the surrounding COM crystals. Fluorescence assessment over a 24-h period showed that M2 macrophages exhibited higher intracellular fluorescence intensity (5.65-times higher than that of M1 macrophages at 4.5 h) and maintained this advantage for 18 h. This study revealed that human iPSC-derived macrophages have the ability to phagocytose COM crystals, presenting a new approach for studying urinary stone formation and highlighting the potential of iPSC-derived macrophages as a tool to screen nephrolithiasis-related drugs.
© 2024. The Author(s), under exclusive licence to Springer-Verlag GmbH Germany, part of Springer Nature.
-
FC/FACS
-
Homo sapiens (Human)
-
Stem Cells and Developmental Biology
In Cell Reports Medicine on 20 February 2024 by Becker, A. M. D., Decker, A. H., et al.
The human dendritic cell (DC) family has recently been expanded by CD1c+CD14+CD163+ DCs, introduced as DC3s. DC3s are found in tumors and peripheral blood of cancer patients. Here, we report elevated frequencies of CD14+ cDC2s, which restore to normal frequencies after tumor resection, in non-small cell lung cancer patients. These CD14+ cDC2s phenotypically resemble DC3s and exhibit increased PD-L1, MERTK, IL-10, and IDO expression, consistent with inferior T cell activation ability compared with CD14- cDC2s. In melanoma patients undergoing CD1c+ DC vaccinations, increased CD1c+CD14+ DC frequencies correlate with reduced survival. We demonstrate conversion of CD5+/-CD1c+CD14- cDC2s to CD14+ cDC2s by tumor-associated factors, whereas monocytes failed to express CD1c under similar conditions. Targeted proteomics identified IL-6 and M-CSF as dominant drivers, and we show that IL-6R and CSF1R inhibition prevents tumor-induced CD14+ cDC2s. Together, this indicates cDC2s as direct pre-cursors of DC3-like CD1c+CD14+ DCs and provides insights into the importance and modulation of CD14+ DC3s in anti-tumor immune responses.
Copyright © 2024 The Authors. Published by Elsevier Inc. All rights reserved.
-
Homo sapiens (Human)
-
Cancer Research
-
Immunology and Microbiology
Multiomic Analysis of Monocyte-Derived Alveolar Macrophages in Idiopathic Pulmonary Fibrosis
Preprint on Research Square on 5 February 2024 by Zhang, M., Zhang, J., et al.
Background: Monocyte-derived alveolar macrophages (Mo_AMs) are increasingly recognised as potential pathogenic factors for idiopathic pulmonary fibrosis (IPF). While single-cell RNA sequencing (scRNAseq) analysis has proven valuable in the transcriptome profiling of Mo_AMs at single-cell resolution, the integration of scRNAseq with bulk RNA sequencing (bulkseq) and single-cell assay for transposase-accessible chromatin sequencing (scATACseq) may provide additional dimensions of understanding of these cellular populations involved in IPF. Methods We analysed 116 scRNAseq samples, 119 bulkseq samples, and five scATACseq samples of lung tissue. We built a large-scale IPF scRNAseq atlas and then performed the trajectory analysis to explore the developmental path and differences of Mo_AMs subpopulations. Additionally, to determine whether Mo_AMs affected pulmonary function, we projected clinical phenotypes (forced vital capacity, FVC%pred) from the bulkseq dataset onto the scRNAseq atlas using the R package Scissor. To gain a deeper insight into the cell–cell interaction of Mo_AMs, we used the R package CellChat and further validated the downstream mechanism. Finally, we used scATATCseq to uncover the upstream regulatory mechanisms and determine key drivers of transcription factors in Mo_AMs. Results We identified three Mo_AMs clusters: Mon_macs, CCL2_RecMacs, and SPP1_RecMacs. The trajectory analysis further validated the origin and differentiation of these three clusters, and APOE was found to be essential for differentiation of the trajectory. Moreover, the CXCL12/CXCR4 axis was found to be involved in the molecular basis of reciprocal interactions between Mo_AMs and fibroblasts through the activation of the ERK pathway in Mo_AMs. Subsequently, the proportions of CCL2_RecMacs and SPP1_RecMacs were found to be higher in the low-FVC group than in the high-FVC group. Additionally, SPIB (PU.1) , JUNB , JUND , BACH2 , FOSL2 , and SMARCC1 showed stronger association with open chromatin of Mo_AMs than tissue-resident alveolar macrophages. SMAD2 and PPARγ could be the potential drivers during Mo_AM differentiation. Conclusion Mo_AMs may influence FVC% pred and aggravate pulmonary fibrosis through the communication with fibroblasts. Furthermore, Mo_AM differentiation may be regulated by distinctive transcriptional regulators. Overall, through multiomic analysis, this work provides a global overview of how Mo_AMs govern IPF and also helps determine better approaches and intervention therapies.
-
Homo sapiens (Human)
-
Cardiovascular biology
Preprint on Research Square on 12 December 2023 by Okada, T., Okada, A., et al.
Macrophages play a role in nephrolithiasis, offering the possibility of macrophage-mediated preventive therapies. To establish a system for screening drugs that could prevent the formation of kidney stones, we aimed to develop a model using human induced pluripotent stem cell (iPSC)-derived macrophages to study phagocytosis of calcium oxalate monohydrate (COM) crystals. Human iPSCs (201B7) were cultured. CD14 + monocytes were recovered using a stepwise process that involved the utilization of growth factors and cytokines. These cells were then allowed to differentiate into M1 and M2 macrophages. The macrophages were co-cultured with COM crystals and used in the phagocytosis experiments. Live cell imaging using a super-resolution microscope was used to visualize phagocytosis. Intracellular fluorescence intensity was measured using imaging cytometry to quantify phagocytosis. Human iPSCs successfully differentiated into M1 and M2 macrophages. M1 macrophages adhered to the culture plate and moved COM crystals from the periphery to the center of the cell over time, whereas M2 macrophages did not adhere to the culture plate and actively phagocytosed the surrounding COM crystals. Fluorescence assessment over a 24-h period showed that M2 macrophages exhibited higher intracellular fluorescence intensity (5.65 times that of M1 macrophages at 4.5 h) and maintained this advantage for 18 h. This study revealed that human iPSC-derived macrophages have the capacity to phagocytose COM crystals, presenting a new approach for studying urinary stone formation and highlighting the potential of iPSC-derived macrophages as a valuable tool to screen drugs related to nephrolithiasis.
-
Homo sapiens (Human)
-
Stem Cells and Developmental Biology
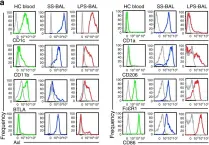
In Nat Commun on 30 April 2019 by Jardine, L., Wiscombe, S., et al.
Fig.3.A

-
FC/FACS
-
Homo sapiens (Human)
Collected and cropped from Nat Commun by CiteAb, provided under a CC-BY license
Image 1 of 1