The aim of the study was to achieve effective colon anticancer immunotherapy using the alkaloid berberine. In the presented paper we attempt to develop a formulation of berberine loaded into liposomal carriers using the vitamin C gradient method, characterized by efficient drug encapsulation, high stability during long-term storage, low drug release in human plasma with specific cytotoxicity towards colon cancer cells. Liposomal berberine was responsible for the induction of oxidative stress, the presence of Ca2+ ions in the cytosol, the reduction of Δψm, and ATP depletion with a simultaneous lack of caspase activity. Moreover, treatment with liposomal berberine led to CRT exposure on the surface of cancer cells, extracellular ATP, and HMGB1 release. The above-described mechanism of action was most likely associated with ICD induction, contributing to the increased number of phagocytic cancer cells. We have shown that cancer cells treated with liposomal berberine were phagocytosed more frequently by macrophages compared to the untreated cancer cells. What is more, we have shown that macrophage pre-treatment with liposomal berberine led to a 3-fold change in the number of phagocytosed SW620 cancer cells. The obtained results provide new insights into the role of berberine in maintaining the immune response against colorectal cancer.
Product Citations: 28
Dual Role of Vitamin C-Encapsulated Liposomal Berberine in Effective Colon Anticancer Immunotherapy.
In Pharmaceuticals (Basel, Switzerland) on 20 December 2023 by Mianowska, M., Zaremba-Czogalla, M., et al.
-
Homo sapiens (Human)
-
Immunology and Microbiology
In Nature Immunology on 1 June 2023 by Gullotta, G. S., De Feo, D., et al.
Aging accounts for increased risk and dismal outcome of ischemic stroke. Here, we investigated the impact of age-related changes in the immune system on stroke. Upon experimental stroke, compared with young mice, aged mice had increased neutrophil clogging of the ischemic brain microcirculation, leading to worse no-reflow and outcomes. Aged mice showed an enhanced granulopoietic response to stroke that led to the accumulation of CD101+CD62Llo mature and CD177hiCD101loCD62Llo and CD177loCD101loCD62Lhi immature atypical neutrophils in the blood, endowed with increased oxidative stress, phagocytosis and procoagulant features. Production of CXCL3 by CD62Llo neutrophils of the aged had a key role in the development and pathogenicity of aging-associated neutrophils. Hematopoietic stem cell rejuvenation reverted aging-associated neutropoiesis and improved stroke outcome. In elderly patients with ischemic stroke, single-cell proteome profile of blood leukocytes identified CD62Llo neutrophil subsets associated with worse reperfusion and outcome. Our results unveil how stroke in aging leads to a dysregulated emergency granulopoiesis impacting neurological outcome.
© 2023. The Author(s), under exclusive licence to Springer Nature America, Inc.
-
CyTOF
-
Mus musculus (House mouse)
-
Cardiovascular biology
-
Immunology and Microbiology
-
Pathology
In Xenotransplantation on 1 March 2022 by Miura, S., Habibabady, Z. A., et al.
Loss of barrier function when GalTKO.hCD46 porcine lungs are perfused with human blood is associated with coagulation pathway dysregulation, innate immune system activation, and rapid sequestration of human formed blood elements. Here, we evaluate whether genetic expression of human tissue factor pathway inhibitor (hTFPI) and human CD47 (hCD47), alone or with combined selectin and integrin adhesion pathway inhibitors, delays GalTKO.hCD46 porcine lung injury or modulates neutrophil and platelet sequestration.
In a well-established paired ex vivo lung perfusion model, GalTKO.hCD46.hTFPI.hCD47 transgenic porcine lungs (hTFPI.hCD47, n = 7) were compared to GalTKO.hCD46 lungs (reference, n = 5). All lung donor pigs were treated with a thromboxane synthase inhibitor, anti-histamine, and anti-GPIb integrin-blocking Fab, and were pre-treated with Desmopressin. In both genotypes, one lung of each pair was additionally treated with PSGL-1 and GMI-1271 (P- and E-selectin) and IB4 (CD11b/18 integrin) adhesion inhibitors (n = 6 hTFPI.hCD47, n = 3 reference).
All except for two reference lungs did not fail within 480 min when experiments were electively terminated. Selectin and integrin adhesion inhibitors moderately attenuated initial pulmonary vascular resistance (PVR) elevation in hTFPI.hCD47 lungs. Neutrophil sequestration was significantly delayed during the early time points following reperfusion and terminal platelet activation was attenuated in association with lungs expressing hTFPI.hCD47, but additional adhesion pathway inhibitors did not show further effects with either lung genotype.
Expression of hTFPI.hCD47 on porcine lung may be useful as part of an integrated strategy to prevent neutrophil adhesion and platelet activation that are associated with xenograft injury. Additionally, targeting canonical selectin and integrin adhesion pathways reduced PVR elevation associated with hTFPI.hCD47 expression, but did not significantly attenuate neutrophil or platelet sequestration. We conclude that other adhesive mechanisms mediate the residual sequestration of human formed blood elements to pig endothelium that occurs even in the context of the multiple genetic modifications and drug treatments tested here.
© 2022 John Wiley & Sons A/S. Published by John Wiley & Sons Ltd.
-
Cardiovascular biology
-
Veterinary Research
Plasmodium vivax binds host CD98hc (SLC3A2) to enter immature red blood cells.
In Nature Microbiology on 1 August 2021 by Malleret, B., El Sahili, A., et al.
More than one-third of the world's population is exposed to Plasmodium vivax malaria, mainly in Asia1. P. vivax preferentially invades reticulocytes (immature red blood cells)2-4. Previous work has identified 11 parasite proteins involved in reticulocyte invasion, including erythrocyte binding protein 2 (ref. 5) and the reticulocyte-binding proteins (PvRBPs)6-10. PvRBP2b binds to the transferrin receptor CD71 (ref. 11), which is selectively expressed on immature reticulocytes12. Here, we identified CD98 heavy chain (CD98), a heteromeric amino acid transporter from the SLC3 family (also known as SLCA2), as a reticulocyte-specific receptor for the PvRBP2a parasite ligand using mass spectrometry, flow cytometry, biochemical and parasite invasion assays. We characterized the expression level of CD98 at the surface of immature reticulocytes (CD71+) and identified an interaction between CD98 and PvRBP2a expressed at the merozoite surface. Our results identify CD98 as an additional host membrane protein, besides CD71, that is directly associated with P. vivax reticulocyte tropism. These findings highlight the potential of using PvRBP2a as a vaccine target against P. vivax malaria.
© 2021. The Author(s), under exclusive licence to Springer Nature Limited.
-
Cardiovascular biology
Luteolin promotes macrophage-mediated phagocytosis by inhibiting CD47 pyroglutamation.
In Translational Oncology on 1 August 2021 by Li, Z., Gu, X., et al.
'Don't eat me' signal of CD47 is activated via its interaction with SIRPα protein on myeloid cells, especially phagocytic cells, and prevents malignant cells from anti-tumor immunity in which pyroglutamate modification of CD47 by glutaminyl-peptide cyclotransferase-like protein (isoQC) takes an important part evidenced by our previous report that isoQC is an essential regulator for CD47-SIRPα axis with a strong inhibition on macrophage-mediated phagoctyosis. Therefore, we screened for potential isoQC inhibitors by fluorescence-activated cell sorting assay and identified luteolin as a potent compound that blocked the pyroglutamation of CD47 by isoQC. We further demonstrated that luteolin directly bound to isoQC using pull-down assay and isothermal calorimetric (ITC) assay. In consistency, we showed that luteolin markedly abrogated the cell-surface interaction between CD47 and SIRPα in multiple myeloma H929 cells and consequently promoted the macrophage-mediated phagocytosis. Collectively, our study discovered a promising lead compound targeting isoQC, luteolin, which functions distinctly from current CD47 antibody-based drugs and therefore may potentially overcome the clinical side effects associated with CD47 antibody treatment-induced anemia.
Copyright © 2021. Published by Elsevier Inc.
-
Immunology and Microbiology
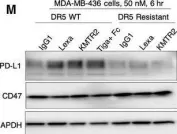
In EMBO Mol Med on 5 March 2021 by Mondal, T., Shivange, G. N., et al.
Fig.1.M

-
WB
-
Collected and cropped from EMBO Mol Med by CiteAb, provided under a CC-BY license
Image 1 of 2
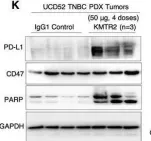
In EMBO Mol Med on 5 March 2021 by Mondal, T., Shivange, G. N., et al.
Fig.1.K

-
WB
-
Collected and cropped from EMBO Mol Med by CiteAb, provided under a CC-BY license
Image 1 of 2