
Elevated de novo lipid synthesis is a remarkable adaptation of cancer cells that can be exploited for therapy. However, the role of altered lipid metabolism in the regulation of apoptosis is still poorly understood. Using thermal proteome profiling, we identified Manidipine-2HCl, targeting UGT8, a key enzyme in the synthesis of sulfatides. In agreement, lipidomic analysis indicated that sulfatides are strongly reduced in colorectal cancer cells upon treatment with Manidipine-2HCl. Intriguingly, this reduction led to severe mitochondrial swelling and a strong synergism with BH3 mimetics targeting BCL-XL, leading to the activation of mitochondria-dependent apoptosis. Mechanistically, Manidipine-2HCl enhanced mitochondrial BAX localization in a sulfatide-dependent fashion, facilitating its activation by BH3 mimetics. In conclusion, our data indicates that UGT8 mediated synthesis of sulfatides controls mitochondrial homeostasis and BAX localization, dictating apoptosis sensitivity of colorectal cancer cells.
© 2024. The Author(s).
Product Citations: 143
In Cell Death and Differentiation on 1 April 2025 by Zhang, L., Ramesh, P., et al.
-
Cancer Research
-
Cell Biology
Effects of Vinorelbine on M2 Macrophages in Non-Small Cell Lung Cancer.
In International Journal of Molecular Sciences on 3 March 2025 by Al-Omar, A., Asadi, M., et al.
Tumor-associated macrophages (TAMs) significantly influence tumor progression and patient responses to conventional chemotherapy. However, the interplay between anti-cancer drugs, immune responses in the tumor microenvironment, and their implications for cancer treatment remains poorly understood. This study investigates the effects of vinorelbine on M2 macrophages in lung cancer and its capacity to modulate TAMs toward an M1 phenotype. Peripheral blood mononuclear cells (PBMCs) were polarized into M2 macrophages, and subsequent phenotype alterations upon vinorelbine treatment were assessed. Additionally, we evaluated vinorelbine's impact on gene and protein expression associated with cancer progression and cell invasion in non-small-cell lung cancer (NSCLC) cells indirectly co-cultured with M2 macrophages. Notably, vinorelbine, particularly at low concentrations, reprogrammed M2 macrophages to exhibit M1-like characteristics. While M2 macrophages enhanced cancer cell invasion, vinorelbine significantly mitigated this effect. M2 macrophages led to the overexpression of numerous genes linked to tumor growth, angiogenesis, invasion, and immune suppression in NSCLC cells, increasing the BCL2/BAX ratio and promoting cellular resistance to apoptosis. The anti-tumor efficacy of vinorelbine appears to be partly attributed to the reprogramming of M2 macrophages to the M1 phenotype, suggesting that low-dose vinorelbine may optimize therapeutic outcomes while minimizing toxicity in cancer patients.
-
WB
-
Cancer Research
In BioFactors (Oxford, England) on 4 August 2024 by Das, A., Mitra, A., et al.
Groundwater arsenic is a notorious toxicant and exposure to environmentally relevant concentrations persists as a healthcare burden across the world. Arsenic has been reported to jeopardize the normal functioning of the immune system, but there are still gaps in the understanding of thymic T cell biology. Immunotoxic influence of arsenic in thymic integrity demands a potent restorative molecule. The objectives of this study were to examine key signaling cross-talks associated with arsenic-induced immune alterations in the thymus and propose melatonin as a potential candidate against immunological complications arising from arsenic exposure. Swiss albino mice were exposed to sodium arsenite (0.05 mg/L; in drinking water) and melatonin (IP:10 mg/kg BW) for 28 days. Melatonin successfully protected thymus from arsenic-mediated tissue degeneration and maintained immune homeostasis including T cell maturation and proliferation by mitigating oxidative stress through Nrf2 upregulation. Additionally, melatonin exerted ameliorative effect against arsenic-induced apoptosis and inflammation by inhibiting p53-mediated mitochondrial cell death pathway and NF-κB-p65/STAT3-mediated proinflammatory pathway, respectively. For the first time, we showed that arsenic-induced profibrotic changes were inhibited by melatonin through targeting of inflammation-associated EMT. Our findings clearly demonstrate that melatonin can be a viable and promising candidate in combating arsenic-induced immune toxicity with no collateral damage, making it an important research target.
© 2024 International Union of Biochemistry and Molecular Biology.
-
Immunology and Microbiology
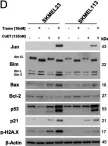
In Journal of Experimental & Clinical Cancer Research : CR on 23 January 2024 by Meraz-Torres, F., Niessner, H., et al.
MEK inhibitors (MEKi) were shown to be clinically insufficiently effective in patients suffering from BRAF wild-type (BRAF WT) melanoma, even if the MAPK pathway was constitutively activated due to mutations in NRAS or NF-1. Thus, novel combinations are needed to increase the efficacy and duration of response to MEKi in BRAF WT melanoma. Disulfiram and its metabolite diethyldithiocarbamate are known to have antitumor effects related to cellular stress, and induction of endoplasmic reticulum (ER) stress was found to synergize with MEK inhibitors in NRAS-mutated melanoma cells. Therefore, we investigated the combination of both therapeutics to test their effects on BRAF-WT melanoma cells and compared them with monotherapy using the MEKi trametinib.
The effects of combined therapy with disulfiram or its metabolite diethyldithiocarbamate and the MEKi trametinib were evaluated in a series of BRAF-WT melanoma cell lines by measuring cell viability and apoptosis induction. Cytotoxicity was additionally assessed in 3D spheroids, ex vivo melanoma slice cultures, and in vivo xenograft mouse models. The response of melanoma cells to treatment was studied at the RNA and protein levels to decipher the mode of action. Intracellular and intratumoral copper measurements were performed to investigate the role of copper ions in the antitumor cytotoxicity of disulfiram and its combination with the MEKi.
Diethyldithiocarbamate enhanced trametinib-induced cytotoxicity and apoptosis induction in 2D and 3D melanoma culture models. Mechanistically, copper-dependent induction of oxidative stress and ER stress led to Janus kinase (JNK)-mediated apoptosis in melanoma cells. This mechanism was also detectable in patient-derived xenograft melanoma models and resulted in a significantly improved therapeutic effect compared to monotherapy with the MEKi trametinib.
Disulfiram and its metabolite represent an attractive pharmaceutical approach to induce ER stress in melanoma cells that potentiates the antitumor effect of MEK inhibition and may be an interesting candidate for combination therapy of BRAF WT melanoma.
© 2024. The Author(s).
-
WB
-
Cancer Research
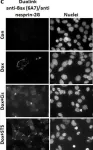
LINC complex protein nesprin-2 has pro-apoptotic activity via Bcl-2 family proteins.
In Cell Death Discovery on 15 January 2024 by Lindenboim, L., Zohar, H., et al.
The apoptotic intrinsic pathway is initiated by perforation of the mitochondrial outer membrane by the effector pro-apoptotic proteins of the Bcl-2 family, Bax and Bak. Bax and Bak need to be activated, a process facilitated by the action of BH3-only pro-apoptotic members of the Bcl-2 family. The latter either directly activates the effector proteins or antagonizes the action of pro-survival Bcl-2 family members such as Bcl-xL. The nuclear envelope is a known target of the apoptotic machinery; however, it may also act as mediator of apoptosis. We showed previously that the nuclear envelope protein nesprin-2, a component of the linker of nucleoskeleton and cytoskeleton (LINC) complex, can bind to Bax in close proximity to the mitochondria and that the binding increases in apoptotic cells. We now show that depleting nesprin-2 inhibits the apoptotic mitochondrial pathway as measured by Bax and Bak activation and cytochrome c release. This survival effect was Bcl-xL-dependent. Nesprin-2 depletion also inhibited spontaneous exposure of the N-terminus of Bak in cells lacking Bcl-xL and increased the presence of Bcl-xL and Bax in the mitochondria. These results indicate that nesprin-2 promotes Bak activation and regulates mitochondrial translocation/retrotranslocation of Bcl-2 family proteins. Our findings demonstrate a new apoptotic pathway whereby the nuclear envelope, via nesprin-2, regulates apoptosis.
© 2024. The Author(s).
In J Exp Clin Cancer Res on 23 January 2024 by Meraz-Torres, F., Niessner, H., et al.
Fig.3.D

-
WB
-
Collected and cropped from J Exp Clin Cancer Res by CiteAb, provided under a CC-BY license
Image 1 of 11
In Cell Death Discov on 8 October 2020 by Lindenboim, L., Grozki, D., et al.
Fig.5.C

-
ICC-IF
-
Collected and cropped from Cell Death Discov by CiteAb, provided under a CC-BY license
Image 1 of 11
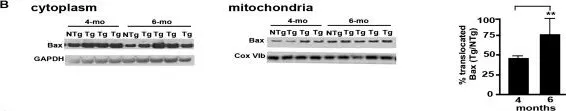
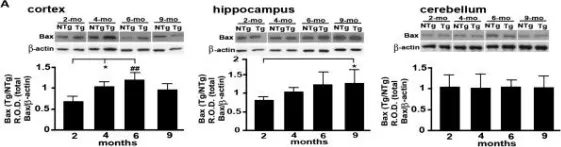
In J Mol Neurosci on 1 April 2020 by Zhang, H. K., Ye, Y., et al.
Fig.9.A

-
SW - Size
-
Rattus norvegicus (Rat)
Collected and cropped from J Mol Neurosci by CiteAb, provided under a CC-BY license
Image 1 of 11
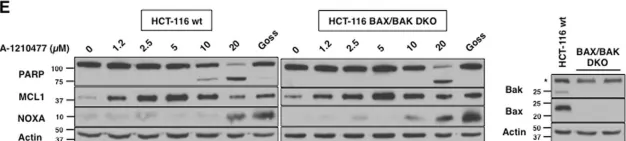
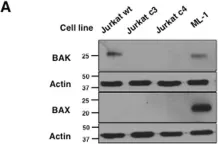
In Cell Death Dis on 22 February 2019 by Mallick, D. J., Soderquist, R. S., et al.
Fig.6.E

-
WB
-
Collected and cropped from Cell Death Dis by CiteAb, provided under a CC-BY license
Image 1 of 11
In Cell Death Dis on 22 February 2019 by Mallick, D. J., Soderquist, R. S., et al.
Fig.6.A

-
WB
-
Collected and cropped from Cell Death Dis by CiteAb, provided under a CC-BY license
Image 1 of 11
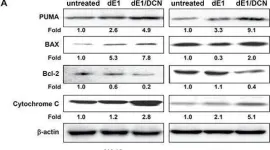
In Oncotarget on 29 September 2017 by Yoon, A. R., Hong, J., et al.
Fig.5.A

-
WB
-
Collected and cropped from Oncotarget by CiteAb, provided under a CC-BY license
Image 1 of 11
In PLoS One on 12 May 2015 by Matsumoto, T., Urushido, M., et al.
Fig.10.E

-
WB
-
Collected and cropped from PLoS One by CiteAb, provided under a CC-BY license
Image 1 of 11
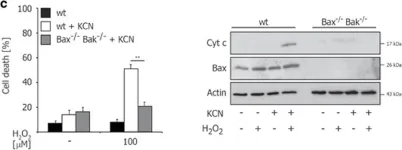
In Cell Death Dis on 12 March 2015 by Schüll, S., Günther, S. D., et al.
Fig.2.C

-
WB
-
Mus musculus (House mouse)
Collected and cropped from Cell Death Dis by CiteAb, provided under a CC-BY license
Image 1 of 11
In BMC Neurosci on 10 June 2014 by Yu, W., Bonnet, M., et al.
Fig.4.B

-
WB
-
Collected and cropped from BMC Neurosci by CiteAb, provided under a CC-BY license
Image 1 of 11
In BMC Neurosci on 10 June 2014 by Yu, W., Bonnet, M., et al.
Fig.4.A

-
WB
-
Collected and cropped from BMC Neurosci by CiteAb, provided under a CC-BY license
Image 1 of 11
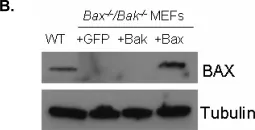
In PLoS One on 22 September 2009 by Snyder, C. M., Shroff, E. H., et al.
Fig.2.B

-
WB
-
Mus musculus (House mouse)
Collected and cropped from PLoS One by CiteAb, provided under a CC-BY license
Image 1 of 11