
Mutations in the Fanconi Anemia (FA) pathway lead to a rare genetic disease that increases risk of bone marrow failure, acute myeloid leukemia, and solid tumors. FA patients have a 500 to 800-fold increase in head and neck squamous cell carcinoma compared to the general population and the treatments for these malignancies are ineffective and limited due to the deficiency in DNA damage repair. Using unbiased CRISPR-interference screening, we found the loss of FA pathway function renders cells dependent on key exocytosis genes such as SNAP23. Further investigation revealed that loss of FA pathway function induced deficiencies in lysosomal health, dysregulation of autophagy and increased lysosomal exocytosis. The compromised cellular state caused by the loss of FA genes is accompanied by decreased lysosome abundance and increased lysosomal membrane permeabilization in cells. We found these signatures in vitro across multiple cell types and cell lines and in clinically relevant FA patient cancers. Our findings are the first to connect the FA pathway to lysosomal exocytosis and thus expands our understanding of FA as a disease and of induced dependencies in FA mutant cancers.
© 2025. The Author(s).
Product Citations: 33
Loss of Fanconi anemia proteins causes a reliance on lysosomal exocytosis.
In Cell Death & Disease on 4 November 2025 by Fu, B. X. H., Xu, A., et al.
-
Cell Biology
Galectin-3 aggravates microglial activation and tau transmission in tauopathy.
In The Journal of Clinical Investigation on 16 January 2024 by Siew, J. J., Chen, H. M., et al.
Alzheimer's disease is characterized by the accumulation of amyloid-β plaques, aggregation of hyperphosphorylated tau (pTau), and microglia activation. Galectin-3 (Gal3) is a β-galactoside-binding protein that has been implicated in amyloid pathology. Its role in tauopathy remains enigmatic. Here, we showed that Gal3 was upregulated in the microglia of humans and mice with tauopathy. pTau triggered the release of Gal3 from human induced pluripotent stem cell-derived microglia in both its free and extracellular vesicular-associated (EV-associated) forms. Both forms of Gal3 increased the accumulation of pathogenic tau in recipient cells. Binding of Gal3 to pTau greatly enhanced tau fibrillation. Besides Gal3, pTau was sorted into EVs for transmission. Moreover, pTau markedly enhanced the number of EVs released by iMGL in a Gal3-dependent manner, suggesting a role of Gal3 in biogenesis of EVs. Single-cell RNA-Seq analysis of the hippocampus of a mouse model of tauopathy (THY-Tau22) revealed a group of pathogenic tau-evoked, Gal3-associated microglia with altered cellular machineries implicated in neurodegeneration, including enhanced immune and inflammatory responses. Genetic removal of Gal3 in THY-Tau22 mice suppressed microglia activation, reduced the level of pTau and synaptic loss in neurons, and rescued memory impairment. Collectively, Gal3 is a potential therapeutic target for tauopathy.
-
Neuroscience
Rab41-mediated ESCRT machinery repairs membrane rupture by a bacterial toxin in xenophagy.
In Nature Communications on 6 October 2023 by Nozawa, T., Toh, H., et al.
Xenophagy, a type of selective autophagy, is a bactericidal membrane trafficking that targets cytosolic bacterial pathogens, but the membrane homeostatic system to cope with bacterial infection in xenophagy is not known. Here, we show that the endosomal sorting complexes required for transport (ESCRT) machinery is needed to maintain homeostasis of xenophagolysosomes damaged by a bacterial toxin, which is regulated through the TOM1L2-Rab41 pathway that recruits AAA-ATPase VPS4. We screened Rab GTPases and identified Rab41 as critical for maintaining the acidification of xenophagolysosomes. Confocal microscopy revealed that ESCRT components were recruited to the entire xenophagolysosome, and this recruitment was inhibited by intrabody expression against bacterial cytolysin, indicating that ESCRT targets xenophagolysosomes in response to a bacterial toxin. Rab41 translocates to damaged autophagic membranes via adaptor protein TOM1L2 and recruits VPS4 to complete ESCRT-mediated membrane repair in a unique GTPase-independent manner. Finally, we demonstrate that the TOM1L2-Rab41 pathway-mediated ESCRT is critical for the efficient clearance of bacteria through xenophagy.
© 2023. Springer Nature Limited.
In The Journal of Investigative Dermatology on 1 September 2023 by Eriksson, I., Vainikka, L., et al.
Lysosomes are central in cell homeostasis and participate in macromolecular degradation, plasma membrane repair, exosome release, cell adhesion/migration, and apoptosis. In cancer, alterations in lysosomal function and spatial distribution may facilitate disease progression. In this study, we show enhanced lysosomal activity in malignant melanoma cells compared with that in normal human melanocytes. Most lysosomes show perinuclear location in melanocytes, while they are more dispersed in melanoma, with retained proteolytic activity and low pH also in the peripheral population. Rab7a expression is lower in melanoma cells than in melanocytes, and by increasing Rab7a, lysosomes are relocated to the perinuclear region in melanoma. Exposure to the lysosome-destabilizing drug L-leucyl-L-leucine methyl ester causes higher damage in the perinuclear subset of lysosomes in melanomas, whereas differences in subpopulation susceptibility cannot be found in melanocytes. Interestingly, melanoma cells recruit the endosomal sorting complex required for transport-III core protein CHMP4B, involved in lysosomal membrane repair, rather than initiate lysophagy. However, when the perinuclear lysosomal position is promoted by Rab7a overexpression or kinesore treatment, lysophagy is increased. In addition, Rab7a overexpression is accompanied by reduced migration capacity. Taken together, the study emphasizes that alterations in lysosomal properties facilitate the malignant phenotype and declares the targeting of lysosomal function as a future therapeutic approach.
Copyright © 2023 The Authors. Published by Elsevier Inc. All rights reserved.
-
WB
-
Cancer Research
-
Cell Biology
In Nature Communications on 6 July 2023 by Zhong, D., Wang, R., et al.
Uranium (U) is a well-known nephrotoxicant which forms precipitates in the lysosomes of renal proximal tubular epithelial cells (PTECs) after U-exposure at a cytotoxic dose. However, the roles of lysosomes in U decorporation and detoxification remain to be elucidated. Mucolipin transient receptor potential channel 1 (TRPML1) is a major lysosomal Ca2+ channel regulating lysosomal exocytosis. We herein demonstrate that the delayed administration of the specific TRPML1 agonist ML-SA1 significantly decreases U accumulation in the kidney, mitigates renal proximal tubular injury, increases apical exocytosis of lysosomes and reduces lysosomal membrane permeabilization (LMP) in renal PTECs of male mice with single-dose U poisoning or multiple-dose U exposure. Mechanistic studies reveal that ML-SA1 stimulates intracellular U removal and reduces U-induced LMP and cell death through activating the positive TRPML1-TFEB feedback loop and consequent lysosomal exocytosis and biogenesis in U-loaded PTECs in vitro. Together, our studies demonstrate that TRPML1 activation is an attractive therapeutic strategy for the treatment of U-induced nephrotoxicity.
© 2023. The Author(s).
-
ICC-IF
-
Cell Biology
In PLoS One on 14 January 2017 by Nakajima, S., Aikawa, C., et al.
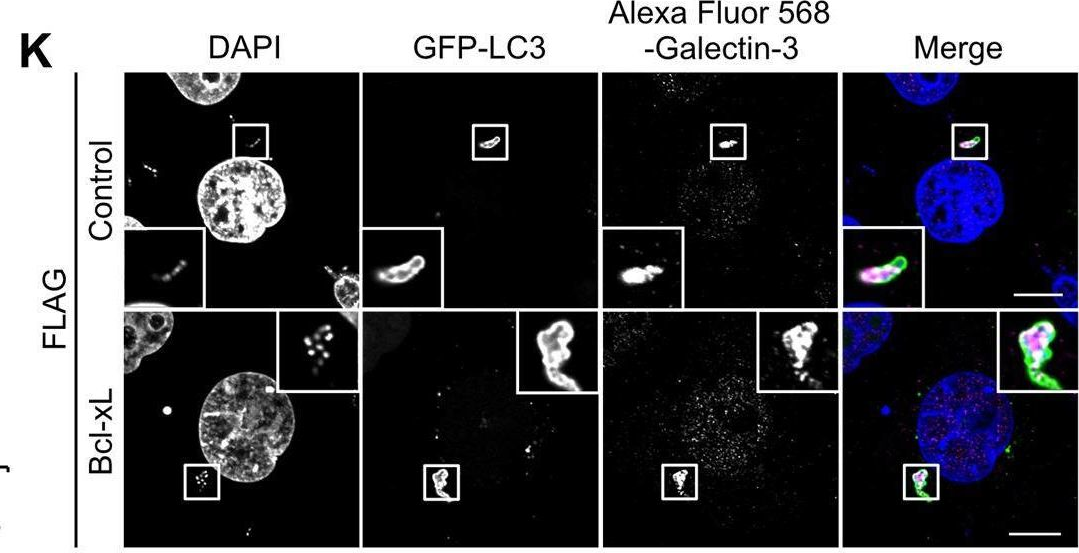
Fig.1.K
-
ICC-IF
-
Collected and cropped from PLoS ONE by CiteAb, provided under a CC-BY license
Image 1 of 4
In PLoS One on 14 January 2017 by Nakajima, S., Aikawa, C., et al.
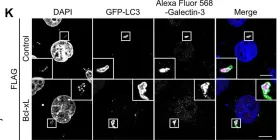
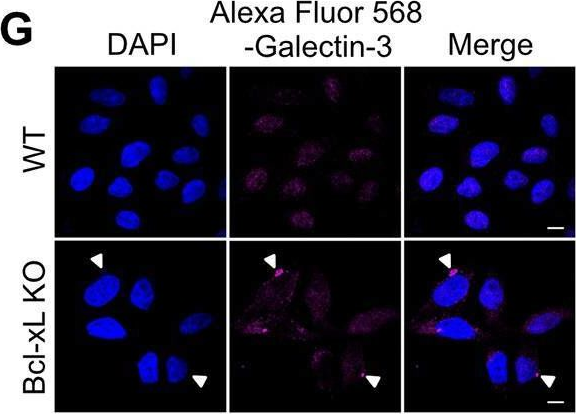
Fig.2.G
-
ICC-IF
-
Collected and cropped from PLoS ONE by CiteAb, provided under a CC-BY license
Image 1 of 4
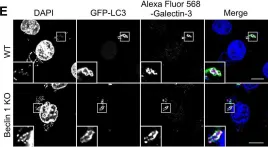
In PLoS One on 14 January 2017 by Nakajima, S., Aikawa, C., et al.
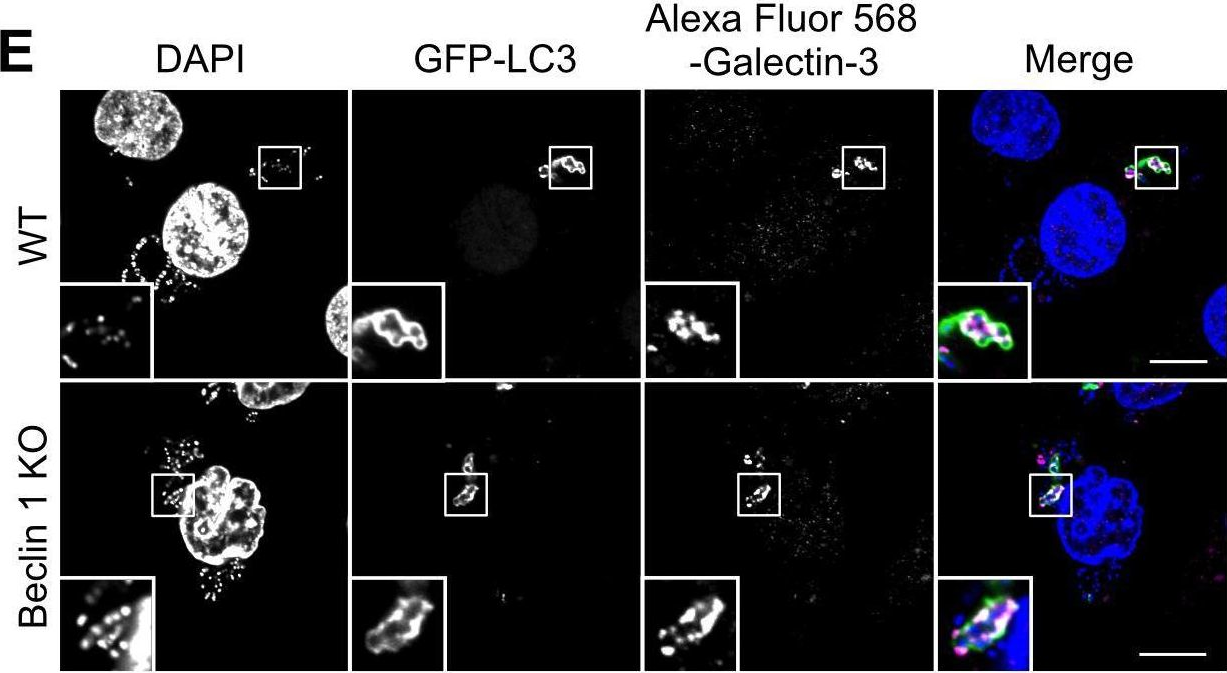
Fig.3.E
-
ICC-IF
-
Collected and cropped from PLoS ONE by CiteAb, provided under a CC-BY license
Image 1 of 4
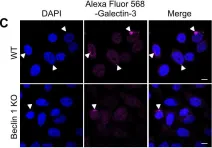
In PLoS One on 14 January 2017 by Nakajima, S., Aikawa, C., et al.
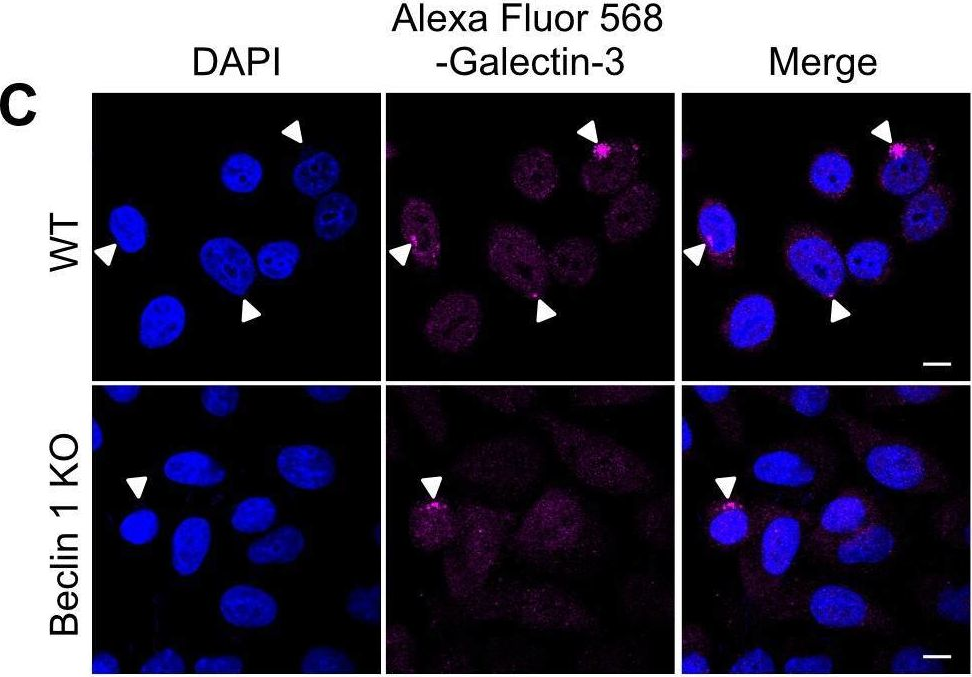
Fig.3.C
-
ICC-IF
-
Collected and cropped from PLoS ONE by CiteAb, provided under a CC-BY license
Image 1 of 4