Aging is the major risk factor for neurodegeneration and is associated with structural and functional alterations in white matter. Myelin is particularly vulnerable to aging, resulting in white matter-associated microglia activation. Here we used pharmacological and genetic approaches to investigate microglial functions related to aging-associated changes in myelinated axons of mice. Our results reveal that maladaptive microglia activation promotes the accumulation of harmful CD8+ T cells, leading to the degeneration of myelinated axons and subsequent impairment of brain function and behavior. We characterize glial heterogeneity and aging-related changes in white matter by single-cell and spatial transcriptomics and reveal elaborate glial-immune interactions. Mechanistically, we show that the CXCL10-CXCR3 axis is crucial for the recruitment and retention of CD8+ T cells in aged white matter, where they exert pathogenic effects. Our results indicate that myelin-related microglia dysfunction promotes adaptive immune reactions in aging and identify putative targets to mitigate their detrimental impact.
© 2025. The Author(s).
Product Citations: 329
In Nature Neuroscience on 1 June 2025 by Groh, J., Feng, R., et al.
-
Immunology and Microbiology
-
Neuroscience
In Nature Communications on 28 March 2025 by Iliopoulou, L., Tzaferis, C., et al.
Crohn's disease (CD) is a persistent inflammatory disorder primarily affecting the terminal ileum. The TnfΔΑRE mice, which spontaneously develop CD-like ileitis due to TNF overexpression, represent a faithful model of the human disease. Here, via single-cell RNA sequencing in TnfΔΑRE mice, we show that murine TNF-dependent ileitis is characterized by cell expansion in tertiary lymphoid organs (TLO), T cell effector reprogramming, and accumulation of activated macrophages in the submucosal granulomas. Within the stromal cell compartment, fibroblast subsets (telocytes, trophocytes, PdgfraloCd81- cells) are less abundant while lymphatic endothelial cells (LEC) and fibroblastic reticular cells (FRC) show relative expansion compared to the wild type. All three fibroblast subsets show strong pro-inflammatory signature. TNFR1 loss or gain of function experiments in specific fibroblast subsets suggest that the TnfΔΑRE-induced ileitis is initiated in the lamina propria via TNF pathway activation in villus-associated fibroblasts (telocytes and PdgfraloCd81- cells), which are responsible for the organization of TLOs. Trophocytes drive disease progression in the submucosal layer, accompanied by the excessive formation of granulomas. These findings provide evidence for spatial regulation of inflammation by fibroblast subsets and underscore the pivotal role of fibroblasts in the inception and advancement of ileitis.
© 2025. The Author(s).
-
FC/FACS
-
Mus musculus (House mouse)
-
Immunology and Microbiology
In PLoS Computational Biology on 1 March 2025 by Wang, G., Zhang, D., et al.
Neutrophils, an essential innate immune cell type with a short lifespan, rely on continuous replenishment from bone marrow (BM) precursors. Although it is established that neutrophils are derived from the granulocyte-macrophage progenitor (GMP), the molecular regulators involved in the differentiation process remain poorly understood. Here we developed a random forest-based machine-learning pipeline, NeuRGI (Neutrophil Regulatory Gene Identifier), which utilized Positive-Unlabeled Learning (PU-learning) and neural network-based in silico gene knockout to identify neutrophil regulators. We interrogated features including gene expression dynamics, physiological characteristics, pathological relatedness, and gene conservation for the model training. Our identified pipeline leads to identifying Mitogen-Activated Protein Kinase-4 (MAP4K4) as a novel neutrophil differentiation regulator. The loss of MAP4K4 in hematopoietic stem cells and progenitors in mice induced neutropenia and impeded the differentiation of neutrophils in the bone marrow. By modulating the phosphorylation level of proteins involved in cell apoptosis, such as STAT5A, MAP4K4 delicately regulates cell apoptosis during the process of neutrophil differentiation. Our work presents a novel regulatory mechanism in neutrophil differentiation and provides a robust prediction model that can be applied to other cellular differentiation processes.
Copyright: © 2025 Wang et al. This is an open access article distributed under the terms of the Creative Commons Attribution License, which permits unrestricted use, distribution, and reproduction in any medium, provided the original author and source are credited.
-
FC/FACS
-
Mus musculus (House mouse)
In Cell Transplantation on 21 February 2025 by Forgioni, A., Watanabe, M., et al.
Pancreatic islet transplantation (PITx) is a promising treatment option for patients with type 1 diabetes mellitus. Previously, we demonstrated that therapy with alloantigen-specific immunomodulatory cells (IMCs) generated ex vivo in the presence of anti-CD80 and CD86 monoclonal antibodies (mAbs), successfully induced tolerance following clinical liver transplantation. To extend IMC therapy to PITx, it is crucial to address the strong inflammatory and innate immune responses that occur immediately after PITx. In this study, we investigated the efficacy of IMCs in modulating macrophage activation and mitigating inflammatory damage of pancreatic islets. IMCs were induced using mouse splenocytes in the presence of anti-mouse anti-CD80 (RM80) and anti-CD86 (GL-1) mAbs. IMCs exerted donor-specific immunosuppressive effects in a mixed lymphocyte reaction. During lipopolysaccharide (LPS) stimulation, the addition of IMCs suppressed conversion to the M1 phenotype and promoted a shift toward the M2 phenotype, particularly under direct cell-cell contact conditions. Nitric oxide production, a hallmark of M1 polarized macrophages, was significantly reduced in LPS-stimulated RAW264 macrophages by IMC treatment. These findings were associated with reduced secretion of pro-inflammatory cytokines, tumoral necrosis factor α, and interleukin-6, and increased interleukin-10 production by macrophages. IMCs effectively prevented macrophage-mediated islet destruction after 12 h of co-culture with LPS-stimulated macrophages and significantly inhibited macrophage migration toward allogeneic islets in vitro. Intraportal co-infusion of IMCs with syngeneic islets in a mouse PITx model resulted in reduced messenger RNA (mRNA) expression of pro-inflammatory cytokines in the recipient liver. Immunohistochemical staining revealed a significantly lower number of F4/80+ macrophages at the transplantation site in IMCs-treated mice. These results demonstrate that IMCs modulate macrophage polarization, promoting a shift toward the M2 phenotype and protecting islets from macrophage-mediated damage. These effects combined with its intrinsic donor antigen-specific immunosuppressive capacity make IMC therapy a promising strategy for improving outcomes after PITx.
-
Immunology and Microbiology
In Frontiers in Immunology on 31 December 2024 by Mediaas, S. D., Haug, M., et al.
The incidence and prevalence of infections with non-tuberculous mycobacteria such as Mycobacterium avium (Mav) are increasing. Prolonged drug regimens, inherent antibiotic resistance, and low cure rates underscore the need for improved treatment, which may be achieved by combining standard chemotherapy with drugs targeting the host immune system. Here, we examined if the diabetes type 2 drug metformin could improve Mav-infection.
Metformin was administered to C57BL/6 mice infected intranasally with Mav and C57BL/6 mice were infected intranasally with Mav and treated with metformin over 3 weeks. Organ bacterial loads and lung pathology, inflammatory cytokines and immune cell profiles were assessed. For mechanistic insight, macrophages infected with Mav were treated with metformin alone or in combination with inhibitors for mitochondrial ROS or AMPK and assessed for bacterial burden and phagosome maturation.
Three weeks of metformin treatment significantly reduced the lung mycobacterial burden in mice infected with Mav without major changes in the overall lung pathology or immune cell composition. Metformin treatment had no significant impact on tissue inflammation except for a tendency of increased lung IFNγ and infiltration of Mav-specific IFNγ-secreting T cells. Metformin did, however, boost the antimicrobial capacity of infected macrophages directly by modulating metabolism/activating AMPK, increasing mitochondrial ROS and phagosome maturation, and indirectly by bolstering type I immunity. Taken together, our data show that metformin improved the control of Mav-infection in mice, mainly by strengthening antimicrobial defenses in macrophages, and suggest that metformin has potential as an adjunct treatment of Mav infections.
Copyright © 2024 Mediaas, Haug, Louet, Wahl, Gidon and Flo.
-
Immunology and Microbiology
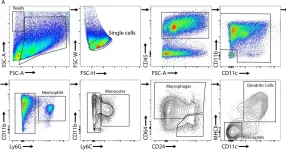
In Elife on 5 September 2024 by Roumelioti, F. M., Tzaferis, C., et al.
Fig.3.A

-
FC/FACS
-
Mus musculus (House mouse)
Collected and cropped from Elife by CiteAb, provided under a CC-BY license
Image 1 of 13
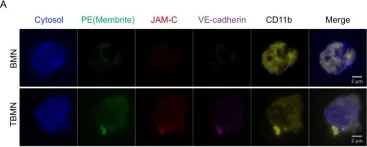
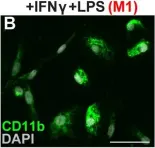
In Mol Med on 8 August 2022 by Takizawa, S., Lee, Y., et al.
Fig.5.A

-
ICC-IF
-
Mus musculus (House mouse)
Collected and cropped from Mol Med by CiteAb, provided under a CC-BY license
Image 1 of 13
In Mol Med on 8 August 2022 by Takizawa, S., Lee, Y., et al.
Fig.6.B

-
ICC-IF
-
Mus musculus (House mouse)
Collected and cropped from Mol Med by CiteAb, provided under a CC-BY license
Image 1 of 13
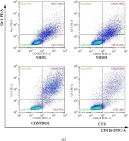
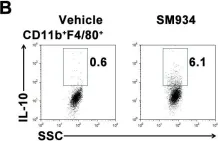
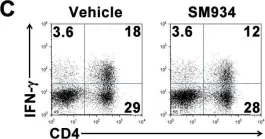
In Evid Based Complement Alternat Med on 26 December 2018 by Mao, D., Feng, L., et al.
Fig.2.A

-
FC/FACS
-
Mus musculus (House mouse)
Collected and cropped from Evid Based Complement Alternat Med by CiteAb, provided under a CC-BY license
Image 1 of 13
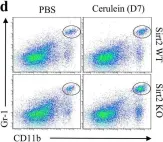
In Sci Rep on 7 November 2018 by Quan, S., Principe, D. R., et al.
Fig.2.D

-
FC/FACS
-
Mus musculus (House mouse)
Collected and cropped from Sci Rep by CiteAb, provided under a CC-BY license
Image 1 of 13
In Sci Rep on 7 November 2018 by Quan, S., Principe, D. R., et al.
Fig.4.E

-
FC/FACS
-
Mus musculus (House mouse)
Collected and cropped from Sci Rep by CiteAb, provided under a CC-BY license
Image 1 of 13
In Oncotarget on 28 November 2017 by Namasu, C. Y., Katzerke, C., et al.
Fig.3.A

-
FC/FACS
-
Collected and cropped from Oncotarget by CiteAb, provided under a CC-BY license
Image 1 of 13
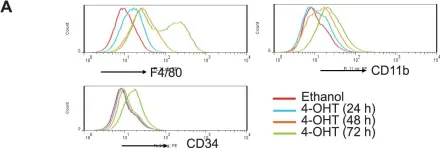
In Elife on 16 May 2017 by Simkin, J., Gawriluk, T. R., et al.
Fig.2.B

-
FC/FACS
-
Mus musculus (House mouse)
Collected and cropped from Elife by CiteAb, provided under a CC-BY license
Image 1 of 13
In Elife on 16 May 2017 by Simkin, J., Gawriluk, T. R., et al.
Fig.2.C

-
FC/FACS
-
Mus musculus (House mouse)
Collected and cropped from Elife by CiteAb, provided under a CC-BY license
Image 1 of 13
In Elife on 16 May 2017 by Simkin, J., Gawriluk, T. R., et al.
Fig.5.B

-
ICC-IF
-
Mus musculus (House mouse)
Collected and cropped from Elife by CiteAb, provided under a CC-BY license
Image 1 of 13
In PLoS One on 4 April 2014 by Karpurapu, M., Ranjan, R., et al.
Fig.2.A

-
FC/FACS
-
Mus musculus (House mouse)
Collected and cropped from PLoS One by CiteAb, provided under a CC-BY license
Image 1 of 13
In PLoS One on 6 March 2012 by Hou, L. F., He, S. J., et al.
Fig.6.B

-
FC/FACS
-
Mus musculus (House mouse)
Collected and cropped from PLoS One by CiteAb, provided under a CC-BY license
Image 1 of 13
In PLoS One on 6 March 2012 by Hou, L. F., He, S. J., et al.
Fig.6.C

-
FC/FACS
-
Mus musculus (House mouse)
Collected and cropped from PLoS One by CiteAb, provided under a CC-BY license
Image 1 of 13
