Chimeric antigen receptor (CAR)-T therapy on acute myeloid leukemia (AML) is hindered by the absence of a suitable tumor-specific antigen. Here, we propose CD97 as a potential target for CAR-T therapy against AML based on its broader and higher expression on AML cells compared to normal hematopoietic stem and progenitor cells (HSPCs). To resolve the fratricide problem caused by CD97 expression on T cells, we knock out CD97 in CAR-T cells using CRISPR-Cas9. Our CD97KO CAR-T cells eliminate both AML cell lines and primary AML cells effectively while showing tolerable toxicity to HSPCs. Furthermore, we mutate the CD3ζ domain of the CAR and find that the optimized CD97 CAR-T cells exhibit persistent anti-tumor activity both in vitro and in multiple xenograft models. Mechanistically, transcriptional profiles reveal that the optimized CAR-T cells delay differentiation and resist exhaustion. Collectively, our study supports CD97 as a promising target for CAR-T therapy against AML.
Copyright © 2025 The Author(s). Published by Elsevier Inc. All rights reserved.
Product Citations: 131
In Cell Reports Medicine on 17 June 2025 by Shang, K., Huang, D., et al.
-
Cancer Research
-
Immunology and Microbiology
Developing CAR-T/NK cells that target EphA2 for non-small cell lung cancer treatment.
In Frontiers in Immunology on 4 April 2025 by Kim, S. M., Lee, S. Y., et al.
Chimeric antigen receptor (CAR) immunotherapy has revolutionized anticancer therapy, as it accurately targets cancer cells by recognizing specific antigens expressed in cancer cells. This innovative therapeutic strategy has attracted considerable attention. However, few therapeutics are available for treating non-small cell lung cancer (NSCLC), which accounts for most lung cancer cases and is one of the deadliest cancers with low survival rates.
In this study, we developed a new antibody targeting erythropoietin-producing hepatocellular carcinoma A2 (EphA2), which is highly expressed in NSCLC, and established CAR-T/ natural killer (NK) immune cells to verify its potential for immune cell therapy. The killing capacity, cytokine secretion and solid tumor growth inhibition of EphA2 CAR-T/NK cells were compared to normal T/NK cells.
EphA2 CAR-T cells demonstrated superior killing capacity, enhanced cytokine secretion, and significant solid tumor growth inhibition. Additionally, they exhibited improved tumor infiltration in lung cancer models compared to normal T cells. The anticancer efficacy of the developed EphA2 CAR-NK cells was also confirmed, showcasing their potential as robust candidates for immune cell therapy.
The findings of this study highlight the potential of CAR-T/NK cell therapy targeting EphA2 as an effective treatment for lung cancer, particularly NSCLC with high EphA2 expression. By leveraging the specific targeting capabilities of CAR-T cells and the unique properties of CAR-NK cells, this approach provides a promising therapeutic strategy to address the unmet needs in NSCLC treatment.
Copyright © 2025 Kim, Lee, Kim, Bae, Hong, Jo, Kim, Chung and Kim.
-
FC/FACS
-
Homo sapiens (Human)
-
Cancer Research
-
Immunology and Microbiology
In EBioMedicine on 1 August 2024 by David, A. F., Heinzel, A., et al.
Induction of donor-specific tolerance is a promising approach to achieve long-term graft patency in transplantation with little to no maintenance immunosuppression. Changes to the recipient's T cell receptor (TCR) repertoire are understood to play a pivotal role in the establishment of a robust state of tolerance in chimerism-based transplantation protocols.
We investigated changes to the TCR repertoires of patients participating in an ongoing prospective, controlled, phase I/IIa trial designed to evaluate the safety and efficacy of combination cell therapy in living donor kidney transplantation. Using high-throughput sequencing, we characterized the repertoires of six kidney recipients who also received bone marrow from the same donor (CKBMT), together with an infusion of polyclonal autologous Treg cells instead of myelosuppression.
Patients undergoing combination cell therapy exhibited partial clonal deletion of donor-reactive CD4+ T cells at one, three, and six months post-transplant, compared to control patients receiving the same immunosuppression regimen but no cell therapy (p = 0.024). The clonality, R20 and turnover rates of the CD4+ and CD8+ TCR repertoires were comparable in both groups, showing our protocol caused no excessive repertoire shift or loss of diversity. Treg clonality was lower in the case group than in control (p = 0.033), suggesting combination cell therapy helps to preserve Treg diversity.
Overall, our data indicate that combining Treg cell therapy with CKBMT dampens the alloimmune response to transplanted kidneys in humans in the absence of myelosuppression.
This study was funded by the Vienna Science and Technology Fund (WWTF).
Copyright © 2024 The Author(s). Published by Elsevier B.V. All rights reserved.
-
Homo sapiens (Human)
-
Immunology and Microbiology
In Mediterranean Journal of Hematology and Infectious Diseases on 17 June 2024 by Sun, K., Wu, C., et al.
Chronic active Epstein-Barr virus disease (CAEBV) is a proliferative disease of EBV+ T or natural killer (NK) cells with an unclear pathogenesis. This study aimed to examine the frequency and exhaustion levels of lymphocyte subsets in patients with CAEBV to further investigate the pathogenesis.
Using flow cytometry, we detected the frequency, expression levels of programmed cell death 1 (PD-1) and programmed death ligand 1 (PD-L1), and EBV infection status of peripheral T subsets and NK cells in patients with CAEBV and healthy individuals.
24 patients and 15 healthy individuals were enrolled in this study. Patients showed notably higher expression levels of PD-1 and PD-L1 in peripheral T subsets and NK cells compared to healthy individuals (P < 0.05). EBV+ lymphocytes exhibited significantly higher PD-L1 expression levels than EBV- lymphocytes. Additionally, the frequency of effector memory T (Tem) cells was significantly increased in patients, and the PD-L1 expression level was positively correlated with the EBV load. Besides, helper T cell 2 (Th2) immune bias, also favoring EBV amplification, was found in patients, including increased Th2 cell frequency, enhanced response capacity, and elevated serum levels of associated cytokines. The distribution and PD-1 expression levels of peripheral T subsets returned to normal in patients who responded to PD-1 blockade therapy.
The up-regulation of the PD-1/PD-L1 pathway of peripheral T and NK cells and Th2 immune predominance jointly promoted EBV replication and the development of CAEBV. PD-1 blockade therapy reduced the PD-1 expression level of lymphocytes and helped normalize the distribution of the T subsets.
-
FC/FACS
-
Immunology and Microbiology
Use of human AML cells to study graft-versus-leukemia immunity in xenogeneic mouse models of GVHD
Preprint on BioRxiv : the Preprint Server for Biology on 2 May 2024 by Faville, C., Silva, B. E., et al.
Allogeneic hematopoietic cell transplantation (allo-HCT) is the main therapeutic approach for patients with high-risk acute myeloid leukemia (AML), but the rate of relapse remains high and is associated with poor outcomes. Discovering new approaches to maximize the graft-versus-leukemia (GVL) effects while mitigating graft-versus-host disease (GVHD) should therefore be pursued. Because of the difficulties in modeling AML in mice, patient-derived xenotransplantations (PDX) in immunodeficient NSG mice are preferred to study the GVL effects. In PDX, AML is typically induced through the intravenous injection of cell lines or leukemic blasts obtained from patients. GVHD and GVL effects are induced by (co)-injecting human T cells or peripheral blood mononuclear cells (PBMCs). While this approach enables the induction of systemic leukemia, notably developing in the spleen and bone marrow of the animals, it can also be associated with difficulties in monitoring the disease, notably by flow cytometry. This can be circumvented by using luciferase-expressing AML cells or transplanting the leukemic cells in Matrigel to generate solid tumors that are easier to monitor. Here, we provide detailed instructions on how to prepare human PBMCs and leukemic cells, transplant them, and monitor the disease in NSG mice.
-
Cancer Research
-
Immunology and Microbiology
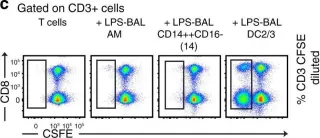
In Nat Commun on 30 April 2019 by Jardine, L., Wiscombe, S., et al.
Fig.3.C

-
FC/FACS
-
Homo sapiens (Human)
Collected and cropped from Nat Commun by CiteAb, provided under a CC-BY license
Image 1 of 5
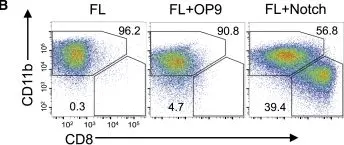
In Cell Rep on 19 June 2018 by Kirkling, M. E., Cytlak, U., et al.
Fig.2.B

-
FC/FACS
-
Mus musculus (House mouse)
Collected and cropped from Cell Rep by CiteAb, provided under a CC-BY license
Image 1 of 5
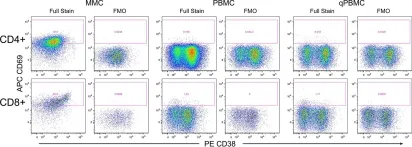
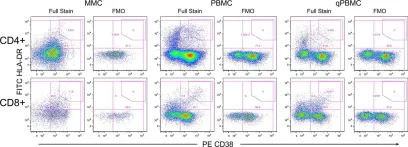
In PLoS One on 27 May 2015 by McGowan, I., Anton, P. A., et al.
Fig.2.A

-
FC/FACS
-
Homo sapiens (Human)
Collected and cropped from PLoS One by CiteAb, provided under a CC-BY license
Image 1 of 5
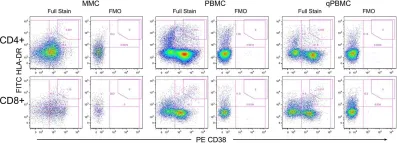
In PLoS One on 27 May 2015 by McGowan, I., Anton, P. A., et al.
Fig.2.B

-
FC/FACS
-
Homo sapiens (Human)
Collected and cropped from PLoS One by CiteAb, provided under a CC-BY license
Image 1 of 5
In PLoS One on 27 May 2015 by McGowan, I., Anton, P. A., et al.
Fig.2.C

-
FC/FACS
-
Homo sapiens (Human)
Collected and cropped from PLoS One by CiteAb, provided under a CC-BY license
Image 1 of 5