The benefit of immune checkpoint blockade for cancer therapy is limited to subsets of patients because of factors including the accumulation of immunosuppressive metabolites, such as adenosine, within tumors. Pharmacological inhibition of adenosine generation and signaling is an active area of clinical investigation, but only limited clinical benefit has been reported. Here, we show that adenosine suppresses anti-cancer T cell responses following uptake into activated T cells by equilibrative nucleoside transporter 1 (ENT1) and inhibition of de novo pyrimidine nucleotide synthesis. We identify EOS301984 as a potent ENT1 antagonist that restores pyrimidine levels in activated T cells in adenosine-rich environments, resulting in enhanced tumor cell killing by memory T cells and increased ex vivo expansion of functional human tumor-infiltrating lymphocytes. A combination of EOS301984 with anti-PD-1 led to synergistic control of tumor growth in a humanized mouse model of triple-negative breast cancer. ENT1 inhibition, therefore, augments anti-cancer immune responses through the restoration of pyrimidine nucleotide synthesis in T cells suppressed by adenosine.
© 2025. The Author(s).
Product Citations: 103
Inhibition of ENT1 relieves intracellular adenosine-mediated T cell suppression in cancer.
In Nature Immunology on 1 June 2025 by Sanders, T., Nabel, C. S., et al.
-
Cancer Research
-
Genetics
-
Immunology and Microbiology
In NPJ Vaccines on 1 March 2025 by Kumar, D., Gaikwad, K., et al.
Selecting a booster vaccine strategy that generates cellular immune breadth is crucial for effectively recalling cellular reservoirs upon infection with severe acute respiratory syndrome coronavirus-2 (SARS-CoV-2) variants. This post hoc analysis from a multicentre, randomized phase 3 study (CTRI/2022/10/046475) compared the cellular immune breadth induced by self-replicating mRNA (samRNA) vaccine GEMCOVAC-OM, encoding Omicron B.1.1.529 Spike protein, with the adenovector vaccine ChAdOx1 nCoV-19, encoding Wuhan variant Spike protein, when administered as a booster. GEMCOVAC-OM elicited significant expansion of memory B-cells (MBCs) specific to Omicron B.1.1.529, compared to ChAdOx1 nCoV-19. GEMCOVAC-OM also induced more B-cells reactive to Omicron XBB.1.5 and BA.2.86 Spike proteins. Additionally, GEMCOVAC-OM triggered higher frequencies of Omicron-Spike-specific T-cells, including stem cell, central, and effector memory subsets. In summary, while ChAdOx1 nCoV-19 showed some cross-reactivity, GEMCOVAC-OM induced a more targeted immune response. GEMCOVAC-OM offers a broader, longer-lasting immunity, making it a promising candidate for future vaccine development and global distribution.
© 2025. The Author(s).
-
Homo sapiens (Human)
-
COVID-19
-
Genetics
-
Immunology and Microbiology
In Journal of Translational Medicine on 27 September 2024 by Court, A. C., Parra-Crisóstomo, E., et al.
Apoptosis, a form of programmed cell death, is critical for the development and homeostasis of the immune system. Chimeric antigen receptor T (CAR-T) cell therapy, approved for hematologic cancers, retains several limitations and challenges associated with ex vivo manipulation, including CAR T-cell susceptibility to apoptosis. Therefore, strategies to improve T-cell survival and persistence are required. Mesenchymal stem/stromal cells (MSCs) exhibit immunoregulatory and tissue-restoring potential. We have previously shown that the transfer of umbilical cord MSC (UC-MSC)-derived mitochondrial (MitoT) prompts the genetic reprogramming of CD3+ T cells towards a Treg cell lineage. The potency of T cells plays an important role in effective immunotherapy, underscoring the need for improving their metabolic fitness. In the present work, we evaluate the effect of MitoT on apoptotis of native T lymphocytes and engineered CAR-T cells.
We used a cell-free approach using artificial MitoT (Mitoception) of UC-MSC derived MT to peripheral blood mononuclear cells (PBMCs) followed by RNA-seq analysis of CD3+ MitoTpos and MitoTneg sorted cells. Target cell apoptosis was induced with Staurosporine (STS), and cell viability was evaluated with Annexin V/7AAD and TUNEL assays. Changes in apoptotic regulators were assessed by flow cytometry, western blot, and qRT-PCR. The effect of MitoT on 19BBz CAR T-cell apoptosis in response to electroporation with a non-viral transposon-based vector was assessed with Annexin V/7AAD.
Gene expression related to apoptosis, cell death and/or responses to different stimuli was modified in CD3+ T cells after Mitoception. CD3+MitoTpos cells were resistant to STS-induced apoptosis compared to MitoTneg cells, showing a decreased percentage in apoptotic T cells as well as in TUNEL+ cells. Additionally, MitoT prevented the STS-induced collapse of the mitochondrial membrane potential (MMP) levels, decreased caspase-3 cleavage, increased BCL2 transcript levels and BCL-2-related BARD1 expression in FACS-sorted CD3+ T cells. Furthermore, UC-MSC-derived MitoT reduced both early and late apoptosis in CAR-T cells following electroporation, and exhibited an increasing trend in cytotoxic activity levels.
Artificial MitoT prevents STS-induced apoptosis of human CD3+ T cells by interfering with the caspase pathway. Furthermore, we observed that MitoT confers protection to apoptosis induced by electroporation in MitoTpos CAR T-engineered cells, potentially improving their metabolic fitness and resistance to environmental stress. These results widen the physiological perspective of organelle-based therapies in immune conditions while offering potential avenues to enhance CAR-T treatment outcomes where their viability is compromised.
© 2024. The Author(s).
-
Homo sapiens (Human)
-
Cell Biology
-
Immunology and Microbiology
-
Stem Cells and Developmental Biology
Cervical mucosal inflammation expands functional polymorphonuclear myeloid-derived suppressor cells
Preprint on MedRxiv : the Preprint Server for Health Sciences on 10 July 2024 by Pieren, D. K., Benítez-Martínez, A., et al.
The mucosal immune system plays a fundamental role in maintaining microbial balance. Microbial imbalance in the female genital tract increases the risk for adverse health outcomes in women and may increase susceptibility to genital tract infections. Among different relevant immune subsets, myeloid-derived suppressor cells (MDSCs) remain understudied in the context of female genital tract conditions. Here we show that frequency of polymorphonuclear (PMN-) MDSCs increased in the cervical mucosa of women with Chlamydia trachomatis , bacterial vaginosis, or with a coinfection, but not in women with human papillomavirus. Mucosal PMN-MDSC frequencies correlated with mucosal IL-1β in C. trachomatis patients and ex vivo exposure of cervical tissue to C. trachomatis elevated both PMN-MDSC frequencies and IL-1β secretion. Likewise, exposure of cervical tissue to cervicovaginal lavage fluid from C. trachomatis and bacterial vaginosis patients also enhanced PMN-MDSC frequencies. Lastly, cervical MDSCs expressed suppressive mediators and functionally suppressed cytotoxic T-cell responses. Our study identifies IL-1β-stimulated PMN-MDSCs as an immune suppressive mediator in female genital tract infections, potentially contributing to susceptibility to acquiring secondary infections at this site.
-
Immunology and Microbiology
In Nature Medicine on 1 May 2024 by Saraf, A., Gurjar, R., et al.
Here we conducted a multicenter open-label, randomized phase 2 and 3 study to assess the safety and immunogenicity of a severe acute respiratory syndrome coronavirus 2 (SARS-CoV-2) Omicron-specific (BA.1/B.1.1.529), monovalent, thermostable, self-amplifying mRNA vaccine, GEMCOVAC-OM, when administered intradermally as a booster in healthy adults who had received two doses of BBV152 or ChAdOx1 nCoV-19. GEMCOVAC-OM was well tolerated with no related serious adverse events in both phase 2 and phase 3. In phase 2, the safety and immunogenicity of GEMCOVAC-OM was compared with our prototype mRNA vaccine GEMCOVAC-19 (D614G variant-specific) in 140 participants. At day 29 after vaccination, there was a significant rise in anti-spike (BA.1) IgG antibodies with GEMCOVAC-OM (P < 0.0001) and GEMCOVAC-19 (P < 0.0001). However, the IgG titers (primary endpoint) and seroconversion were higher with GEMCOVAC-OM (P < 0.0001). In phase 3, GEMCOVAC-OM was compared with ChAdOx1 nCoV-19 in 3,140 participants (safety cohort), which included an immunogenicity cohort of 420 participants. At day 29, neutralizing antibody titers against the BA.1 variant of SARS-CoV-2 were significantly higher than baseline in the GEMCOVAC-OM arm (P < 0.0001), but not in the ChAdOx1 nCoV-19 arm (P = 0.1490). GEMCOVAC-OM was noninferior (primary endpoint) and superior to ChAdOx1 nCoV-19 in terms of neutralizing antibody titers and seroconversion rate (lower bound 95% confidence interval of least square geometric mean ratio >1 and difference in seroconversion >0% for superiority). At day 29, anti-spike IgG antibodies and seroconversion (secondary endpoints) were significantly higher with GEMCOVAC-OM (P < 0.0001). These results demonstrate that GEMCOVAC-OM is safe and boosts immune responses against the B.1.1.529 variant. Clinical Trial Registry India identifier: CTRI/2022/10/046475 .
© 2024. The Author(s).
-
COVID-19
-
Genetics
-
Immunology and Microbiology
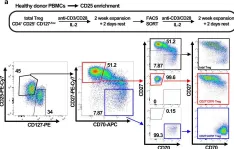
In Commun Biol on 14 July 2020 by Arroyo Hornero, R., Georgiadis, C., et al.
Fig.3.A

-
FC/FACS
-
Collected and cropped from Commun Biol by CiteAb, provided under a CC-BY license
Image 1 of 1