Abstract Selective RNA degradation during terminal erythropoiesis results in a globin-rich transcriptome in mature erythrocytes, but the specific RNA decay pathways remain unknown. We found that deficiency of the terminal uridylyl transferase enzyme Zcchc6 and the 3'-5' exoribonuclease Dis3l2 in mouse models led to fetal and perinatal reticulocytosis, an accumulation of RNA-rich precursors of terminal erythroid cells, suggesting their crucial roles in terminal red cell differentiation. Notably, knockout embryos exhibited persistent high-level expression of Hbb-bh1 globin, the ortholog of human fetal γ-globin. Perturbation of the Zcchc6-Dis3l2 pathway in mice engineered to express the human β-globin locus likewise increased γ-globin levels in fetal erythroid cells, suggesting that globin switching entails post-transcriptional mechanisms of mRNA destabilization in addition to transcriptional down-regulation. We cultured human hematopoietic stem and progenitor cells (HSPCs), performed CRISPR/Cas9-mediated knockout of ZCCHC6 and DIS3L2, and observed accumulation of RNA and elevated γ-globin levels in terminal erythroid cells. Our findings reveal a conserved role for the ZCCHC6/DIS3L2 RNA editors in terminal erythropoiesis and demonstrate a post-transcriptional mechanism for γ-globin gene switching, advancing research into in vitro erythrocyte generation and γ-globin stabilization to ameliorate hemoglobinopathies.
Product Citations: 67
RNA Editors Sculpt the Transcriptome During Terminal Erythropoiesis
Preprint on Research Square on 24 April 2025 by Daley, G., Han, A., et al.
-
Genetics
RNA Editors Sculpt the Transcriptome During Terminal Erythropoiesis
Preprint on BioRxiv : the Preprint Server for Biology on 5 April 2025 by Han, A., Yermalovich, A., et al.
ABSTRACT Selective RNA degradation during terminal erythropoiesis results in a globin-rich transcriptome in mature erythrocytes, but the specific RNA decay pathways remain unknown. We found that deficiency of the terminal uridylyl transferase enzyme Zcchc6 and the 3’-5’ exoribonuclease Dis3l2 in mouse models led to fetal and perinatal reticulocytosis, an accumulation of RNA-rich precursors of terminal erythroid cells, suggesting their crucial roles in terminal red cell differentiation. Notably, knockout embryos exhibited persistent high-level expression of Hbb-bh1 globin, the ortholog of human fetal γ- globin. Perturbation of the Zcchc6-Dis3l2 pathway in mice engineered to express the human β-globin locus likewise increased γ -globin levels in fetal erythroid cells, suggesting that globin switching entails post-transcriptional mechanisms of mRNA destabilization in addition to transcriptional down-regulation. We cultured human hematopoietic stem and progenitor cells (HSPCs), performed CRISPR/Cas9-mediated knockout of ZCCHC6 and DIS3L2, and observed accumulation of RNA and elevated γ-globin levels in terminal erythroid cells. Our findings reveal a conserved role for the ZCCHC6/DIS3L2 RNA editors in terminal erythropoiesis and demonstrate a post-transcriptional mechanism for γ- globin gene switching, advancing research into in vitro erythrocyte generation and γ- globin stabilization to ameliorate hemoglobinopathies.
-
Genetics
Lymphatic collection and cell isolation from mouse models for multiomic profiling.
In Nature Protocols on 1 April 2025 by Sabatier, M., Solanki, A., et al.
Premetastatic cancer cells often spread from the primary lesion through the lymphatic vasculature and, clinically, the presence or absence of lymph node metastases impacts treatment decisions. However, little is known about cancer progression via the lymphatic system or of the effect that the lymphatic environment has on cancer progression. This is due, in part, to the technical challenge of studying lymphatic vessels and collecting lymph fluid. Here we provide a step-by-step procedure to collect both lymph and tumor-draining lymph in mouse models of cancer metastasis. This protocol has been adapted from established methods of lymph collection and was developed specifically for the collection of lymph from tumors. The approach involves the use of mice bearing melanoma or breast cancer orthotopic tumors. After euthanasia, the cisterna chyli and the tumor are exposed and viewed using a stereo microscope. Then, a glass cannula connected to a 1 mL syringe is inserted directly into the cisterna chyli or the tumor-draining lymphatics for collection of pure lymph. These lymph samples can be used to analyze the lymph-derived cancer cells using highly sensitive multiomics approaches to investigate the impact of the lymph environment during cancer metastasis. The procedure requires 2 h per mouse to complete and is suitable for users with minimal expertise in small animal handling and use of microsurgical tools under a stereo microscope.
© 2025. Springer Nature Limited.
In Genes on 28 March 2025 by Xie, B. & Dean, A.
Background/Objectives: Enhancer RNAs (eRNAs) function in diverse modes and increasing studies have shown that they play important roles in normal development and disease. However, their role in erythropoiesis is not fully understood. Methods: We analyzed published RNA-seq and Promoter Capture Hi-C data from mouse E14.5 fetal liver cells to identify enhancer RNAs in erythroid cells with long-range interactions. Results: We discovered an erythroid-specific enhancer RNA (CpoxeRNA) transcribed from an enhancer region upstream of Cpox, an enzyme important for heme synthesis. CpoxeRNA is important for erythropoiesis, as the knockdown of CpoxeRNA by shRNA results in impaired enucleation and cell proliferation during terminal differentiation. CpoxeRNA interacts with cohesin and acts both in cis and trans to regulate erythroid genes. Conclusions: we have identified a trans-acting eRNA, CpoxeRNA, as a potential regulator of terminal erythropoiesis.
-
Genetics
In Proceedings of the National Academy of Sciences of the United States of America on 25 March 2025 by Dos S P Andrade, A. C., Lacasse, E., et al.
Platelets, known for maintaining blood balance, also participate in antimicrobial defense. Upon severeacute respiratory syndrome coronavirus 2 (SARS-CoV-2) infection, platelets become hyperactivated, releasing molecules such as cytokines, granule contents, and bioactive lipids. The key effector biolipids produced by platelets include 12-hydroxyeicosatetraenoic acid (12-HETE) and 12-hydroxyeicosatrienoic acid (12-HETrE), produced by 12-lipoxygenase (12-LOX), and prostaglandins and thromboxane, produced by cyclooxygenase-1. While prostaglandin E2 and thromboxane B2 were previously associated with lung inflammation in severe COVID-19, the role of platelet 12-LOX in SARS-CoV-2 infection remains unclear. Using mice deficient for platelets' 12-LOX, we report that SARS-CoV-2 infection resulted in higher lung inflammation characterized by histopathological tissue analysis, increased leukocyte infiltrates, and cytokine production relative to wild-type mice. In addition, distinct platelet and lung transcriptomic changes, including alterations in NOD-like receptor (NLR) family pyrin domain-containing 1 (NLRP1) inflammasome-related gene expression, were observed. Mass spectrometry lipidomic analysis in 12-LOX-deficient-infected mice revealed significant changes in bioactive lipid content, including reduced levels of 12-HETrE that inversely correlated with disease severity. Finally, platelet 12-LOX deficiency was associated with increased morbidity and lower survival rates relative to wild type (WT) mice. Overall, this study highlights the complex interplay between 12-LOX-related lipid metabolism and inflammatory responses during SARS-CoV-2 infection. The findings provide valuable insights into potential therapeutic targets aimed at mitigating severe outcomes, emphasizing the pivotal role of platelet enzymes in the host response to viral infections.
-
COVID-19
-
Immunology and Microbiology
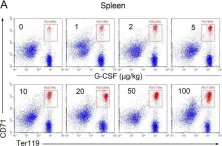
In Life Sci Alliance on 1 January 2021 by Jing, W., Guo, X., et al.
Fig.2.A

-
FC/FACS
-
Collected and cropped from Life Sci Alliance by CiteAb, provided under a CC-BY license
Image 1 of 3
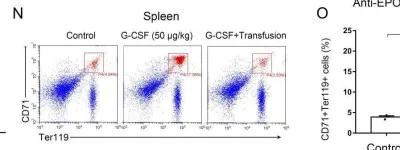
In Life Sci Alliance on 1 January 2021 by Jing, W., Guo, X., et al.
Fig.6.N

-
FC/FACS
-
Collected and cropped from Life Sci Alliance by CiteAb, provided under a CC-BY license
Image 1 of 3
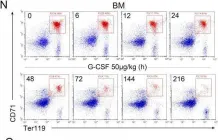
In Life Sci Alliance on 1 January 2021 by Jing, W., Guo, X., et al.
Fig.1.N

-
FC/FACS
-
Collected and cropped from Life Sci Alliance by CiteAb, provided under a CC-BY license
Image 1 of 3