Centrosomes composed of centrioles and the pericentriolar material (PCM), serve as the platform for microtubule polymerization during mitosis. Despite some centriole and PCM proteins have been reported to utilize liquid-liquid phase separation (LLPS) to perform their mitotic functions, whether and how centrosomal kinases exert the coacervation in mitosis is still unknown. Here we reveal that Aurora-A, one key centrosomal kinase in regulating centrosome formation and functions, undergoes phase separation in vitro or in centrosomes from prophase, mediated by the conserved positive-charged residues inside its intrinsic disordered region (IDR) and the intramolecular interaction between its N- and C-terminus. Aurora-A condensation affects centrosome maturation, separation, initial spindle formation from the spindle pole and its kinase activity. Moreover, BuGZ interacts with Aurora-A to enhance its LLPS and centrosome functions. Thus, we propose that Aurora-A collaborates with BuGZ to exhibit the property of LLPS in centrosomes to control its centrosome-dependent functions from prophase.
© 2024 The Author(s).
Product Citations: 28
Aurora-A condensation mediated by BuGZ aids its mitotic centrosome functions.
In IScience on 17 May 2024 by Zheng, H., Zhang, Q., et al.
-
Cell Biology
In Cell Death and Differentiation on 1 October 2022 by Zhu, K., Cai, Y., et al.
The proper orientation of centrosome and spindle is essential for genome stability; however, the mechanism that governs these processes remains elusive. Here, we demonstrated that polo-like kinase 1 (Plk1), a key mitotic kinase, phosphorylates residue Thr76 in VCP/p97 (an AAA-ATPase), at the centrosome from prophase to anaphase. This phosphorylation process recruits VCP to the centrosome and in this way, it regulates centrosome orientation. VCP exhibits strong co-localization with Eg5 (a mitotic kinesin motor), at the mitotic spindle, and the dephosphorylation of Thr76 in VCP is required for the enrichment of both VCP and Eg5 at the spindle, thus ensuring proper spindle architecture and chromosome segregation. We also showed that the phosphatase, PTEN, is responsible for the dephosphorylation of Thr76 in VCP; when PTEN was knocked down, the normal spread of VCP from the centrosome to the spindle was abolished. Cryo-EM structures of VCPT76A and VCPT76E, which represent dephosphorylated and phosphorylated states of VCP, respectively, revealed that the Thr76 phosphorylation modulates VCP by altering the inter-domain and inter-subunit interactions, and ultimately the nucleotide-binding pocket conformation. Interestingly, the tumor growth in nude mice implanted with VCPT76A-reconstituted cancer cells was significantly slower when compared with those implanted with VCPWT-reconstituted cancer cells. Collectively, our findings demonstrate that the phosphorylation and dephosphorylation switch of VCP regulates the architecture of centrosome and spindle for faithful chromosome segregation.
© 2022. The Author(s), under exclusive licence to ADMC Associazione Differenziamento e Morte Cellulare.
-
Cell Biology
In Cell Research on 1 February 2022 by Wang, L., Paudyal, S. C., et al.
Cytoskeletal networks play an important role in regulating nuclear morphology and ciliogenesis. However, the role of microtubule (MT) post-translational modifications in nuclear shape regulation and cilium disassembly has not been explored. Here we identified a novel regulator of the tubulin polyglutamylase complex (TPGC), C11ORF49/CSTPP1, that regulates cytoskeletal organization, nuclear shape, and cilium disassembly. Mechanistically, loss of C11ORF49/CSTPP1 impacts the assembly and stability of the TPGC, which modulates long-chain polyglutamylation levels on microtubules (MTs) and thereby balances the binding of MT-associated proteins and actin nucleators. As a result, loss of TPGC leads to aberrant, enhanced assembly of MTs that penetrate the nucleus, which in turn leads to defects in nuclear shape, and disorganization of cytoplasmic actin that disrupts the YAP/TAZ pathway and cilium disassembly. Further, we showed that C11ORF49/CSTPP1-TPGC plays mechanistically distinct roles in the regulation of nuclear shape and cilium disassembly. Remarkably, disruption of C11ORF49/CSTPP1-TPGC also leads to developmental defects in vivo. Our findings point to an unanticipated nexus that links tubulin polyglutamylation with nuclear shape and ciliogenesis.
© 2021. The Author(s), under exclusive licence to Center for Excellence in Molecular Cell Science, CAS.
-
Cell Biology
In Nucleic Acids Research on 21 July 2021 by Peng, B., Shi, R., et al.
Polo-like kinase 1 (PLK1) is a master kinase that regulates cell cycle progression. How its enzymatic activity is regulated in response to DNA damage is not fully understood. We show that PLK1 is enriched at double strand breaks (DSBs) within seconds of UV laser irradiation in a PARP-1-dependent manner and then disperses within 10 min in a PARG-dependent manner. Poly(ADP-)ribose (PAR) chains directly bind to PLK1 in vitro and inhibit its enzymatic activity. CHK1-mediated PLK1 phosphorylation at S137 prevents its binding to PAR and recruitment to DSBs but ensures PLK1 phosphorylation at T210 and its enzymatic activity toward RAD51 at S14. This subsequent phosphorylation event at S14 primes RAD51 for CHK1-mediated phosphorylation at T309, which is essential for full RAD51 activation. This CHK1-PLK1-RAD51 axis ultimately promotes homologous recombination (HR)-mediated repair and ensures chromosome stability and cellular radiosensitivity. These findings provide biological insight for combined cancer therapy using inhibitors of PARG and CHK1.
© The Author(s) 2021. Published by Oxford University Press on behalf of Nucleic Acids Research.
-
Homo sapiens (Human)
-
Biochemistry and Molecular biology
-
Genetics
Aurora kinase A is essential for meiosis in mouse oocytes.
In PLoS Genetics on 1 April 2021 by Blengini, C. S., Ibrahimian, P., et al.
The Aurora protein kinases are well-established regulators of spindle building and chromosome segregation in mitotic and meiotic cells. In mouse oocytes, there is significant Aurora kinase A (AURKA) compensatory abilities when the other Aurora kinase homologs are deleted. Whether the other homologs, AURKB or AURKC can compensate for loss of AURKA is not known. Using a conditional mouse oocyte knockout model, we demonstrate that this compensation is not reciprocal because female oocyte-specific knockout mice are sterile, and their oocytes fail to complete meiosis I. In determining AURKA-specific functions, we demonstrate that its first meiotic requirement is to activate Polo-like kinase 1 at acentriolar microtubule organizing centers (aMTOCs; meiotic spindle poles). This activation induces fragmentation of the aMTOCs, a step essential for building a bipolar spindle. We also show that AURKA is required for regulating localization of TACC3, another protein required for spindle building. We conclude that AURKA has multiple functions essential to completing MI that are distinct from AURKB and AURKC.
-
IHC-IF
-
Mus musculus (House mouse)
-
Cell Biology
-
Genetics
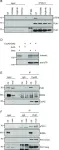
In Life Sci Alliance on 1 March 2021 by Silva Cascales, H., Burdová, K., et al.
Fig.3.B,D,E,F

-
WB
-
Homo sapiens (Human)
Collected and cropped from Life Sci Alliance by CiteAb, provided under a CC-BY license
Image 1 of 2
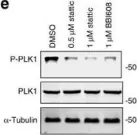
In Nat Commun on 5 May 2017 by Morris, E. J., Kawamura, E., et al.
Fig.4.E

-
WB
-
Homo sapiens (Human)
Collected and cropped from Nat Commun by CiteAb, provided under a CC-BY license
Image 1 of 2