Pulmonary infections are characterized by neutrophil recruitment into the lung driven by chemokine ligands of CXCR2, which is expressed on neutrophils, but also present in non-hematopoietic lung cells, in which its role remains unclear. We hypothesize that CXCR2 in epithelial and endothelial cells contributes to neutrophil recruitment into the lung by modifying the availability of its cognate chemokines in lung alveoli. Using conditional endothelial and epithelial CXCR2 knockout mice, we demonstrate that selective CXCR2 deletion in either compartment impairs neutrophil recruitment into the lung during bacterial pneumonia and reduces bacterial clearance. We show that CXCR2 ablation in epithelial and endothelial cells compromises respective trans-epithelial and trans-endothelial transcytosis of alveolar CXCL1. Mechanistically, CXCR2-mediated CXCL1 endothelial and epithelial cell transcytosis requires the function of Bruton's tyrosine kinase in these cells. In conclusion, CXCR2 plays an important role in alveolar epithelial and endothelial cells, where it mediates cognate chemokine transcytosis, thus actively supporting their activities in neutrophil recruitment to the infected lungs.
© 2025. The Author(s).
Product Citations: 50
Alveolar epithelial and vascular CXCR2 mediates transcytosis of CXCL1 in inflamed lungs.
In Nature Communications on 24 May 2025 by Thomas, K., Rossaint, J., et al.
In Biomarker Research on 9 October 2024 by Zhao, H., Zhao, H., et al.
Traditional topical drug delivery for treating inflammatory skin diseases suffers from poor skin penetration and long-term side effects. Metal nanoparticles show promising application in topical drug delivery for inflammatory skin diseases.
Here, we synthesized a new type of nanoparticles, azelamide monoethanolamine-functionalized gold nanoparticles (Au-MEA NPs), based on citrate-capped gold nanoparticles (Au-CA NPs) via the ligand exchange method. The physical and chemical properties of Au-CA NPs and Au-MEA NPs were characterized. In vivo studies were performed using imiquimod-induced psoriasis and LL37-induced rosacea animal models, respectively. For in vitro studies, a model of cellular inflammation was established using HaCaT cells stimulated with TNF-α. In addition, proteomics, gelatin zymography, and other techniques were used to investigate the possible therapeutic mechanisms of the Au-MEA NPs.
We found that Au-MEA NPs exhibited better stability and permeation properties compared to conventional Au-CA NPs. Transcutaneously administered Au-MEA NPs exerted potent therapeutic efficacy against both rosacea-like and psoriasiform skin dermatitis in vivo without overt signs of toxicity. Mechanistically, Au-MEA NPs reduced the production of pro-inflammatory mediators in keratinocytes by promoting SOD activity and inhibiting the activity of MMP9.
Au-MEA NPs have the potential to be a topical nanomedicine for the effective and safe treatment of inflammatory skin diseases.
© 2024. The Author(s).
-
Mus musculus (House mouse)
-
Immunology and Microbiology
In Nature Communications on 23 August 2024 by Zhang, Y., Li, T., et al.
Rosacea patients show facial hypersensitivity to stimulus factors (such as heat and capsaicin); however, the underlying mechanism of this hyperresponsiveness remains poorly defined. Here, we show capsaicin stimulation in mice induces exacerbated rosacea-like dermatitis but has no apparent effect on normal skin. Nociceptor ablation substantially reduces the hyperresponsiveness of rosacea-like dermatitis. Subsequently, we find that γδ T cells express Ramp1, the receptor of the neuropeptide CGRP, and are in close contact with these nociceptors in the skin. γδ T cells are significantly increased in rosacea skin lesions and can be further recruited and activated by neuron-secreted CGRP. Rosacea-like dermatitis is reduced in T cell receptor δ-deficient (Tcrd-/-) mice, and the nociceptor-mediated aggravation of rosacea-like dermatitis is also reduced in these mice. In vitro experiments show that CGRP induces IL17A secretion from γδ T cells by regulating inflammation-related and metabolism-related pathways. Finally, rimegepant, a CGRP receptor antagonist, shows efficacy in the treatment of rosacea-like dermatitis. In conclusion, our findings demonstrate a neuron-CGRP-γδT cell axis that contributes to the hyperresponsiveness of rosacea, thereby showing that targeting CGRP is a potentially effective therapeutic strategy for rosacea.
© 2024. The Author(s).
-
Mus musculus (House mouse)
-
Immunology and Microbiology
-
Neuroscience
Downregulated SPESP1-driven fibroblast senescence decreases wound healing in aged mice.
In Clinical and Translational Medicine on 1 May 2024 by Zhong, Y., Zhou, L., et al.
Human dermal fibroblasts (HDFs) are essential in the processes of skin ageing and wound healing. However, the underlying mechanism of HDFs in skin healing of the elderly has not been well defined. This study aims to elucidate the mechanisms of HDFs senescence and how senescent HDFs affect wound healing in aged skin.
The expression and function of sperm equatorial segment protein 1 (SPESP1) in skin ageing were evaluated via in vivo and in vitro experiments. To delve into the potential molecular mechanisms by which SPESP1 influences skin ageing, a combination of techniques was employed, including proteomics, RNA sequencing, immunoprecipitation, chromatin immunoprecipitation and liquid chromatography-mass spectrometry analyses. Clearance of senescent cells by dasatinib plus quercetin (D+Q) was investigated to explore the role of SPESP1-induced senescent HDFs in wound healing.
Here, we define the critical role of SPESP1 in ameliorating HDFs senescence and retarding the skin ageing process. Mechanistic studies demonstrate that SPESP1 directly binds to methyl-binding protein, leading to Decorin demethylation and subsequently upregulation of its expression. Moreover, SPESP1 knockdown delays wound healing in young mice and SPESP1 overexpression induces wound healing in old mice. Notably, pharmacogenetic clearance of senescent cells by D+Q improved wound healing in SPESP1 knockdown skin.
Taken together, these findings reveal the critical role of SPESP1 in skin ageing and wound healing, expecting to facilitate the development of anti-ageing strategies and improve wound healing in the elderly.
© 2024 The Authors. Clinical and Translational Medicine published by John Wiley & Sons Australia, Ltd on behalf of Shanghai Institute of Clinical Bioinformatics.
-
Mus musculus (House mouse)
Preprint on Research Square on 8 February 2024 by Geraldes, P., Robillard, S., et al.
Introduction: Chronic wounds are a serious complication of diabetes. Multiple components in the healing process are impaired by diabetes, creating hard-to-heal or non-healing wounds, increasing the risk of infection, enlargement and amputation. Altered angiogenesis is a major contributor of delayed healing process in diabetic wounds. The apenilergic system (APJ/Apelin/ELABELA) is an activator of the angiogenic response in endothelial cells, and apelin treatment has been shown to improve vascular density in animal models of ischemia. This study explored the impact of Pyr-apelin-13 and Pyr-ELABELA-32 on wound healing processes in diabetic mice and on fibroblast function. Methods: : Two full-thickness excisional wounds were created on the mid-back of nondiabetic and diabetic mice. Diabetic mice received topical application of Pyr-apelin-13 or Pyr-ELABELA-32 daily for 14 days, and wounds were individually photographed to measure global wound closure and healing process. In vitro, fibroblasts were exposed to normal (NG) or high glucose (HG) levels and hypoxia. Cell migration and proliferation assays were performed following either Pyr-apelin-13 or Pyr-ELABELA-32 stimulation. Results: : Fourteen days post-injury, global wound closure was improved in diabetic mice receiving Pyr-apelin-13 or Pyr-ELABELA-32 compared to untreated diabetic mice. Wound treatment with Pyr-apelin-13 and Pyr-ELABELA-32 improved re-epithelialization and angiogenesis, reduced inflammation and promoted collagen synthesis in diabetic scar tissue. In cultured fibroblasts, Pyr-apelin-13 and Pyr-ELABELA-32 stimulation induced cell migration and proliferation through Akt and ERK signaling pathways under both NG or HG concentrations and hypoxia exposure. Conclusion: Our results demonstrated the therapeutic potential of the endogenous ligands of APJ, apelin and ELABELA, for the treatment of diabetic wounds.
-
Mus musculus (House mouse)
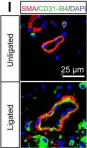
In Elife on 9 August 2016 by Ramo, K., Sugamura, K., et al.
Fig.1.I

-
IHC-IF
-
Mus musculus (House mouse)
Collected and cropped from Elife by CiteAb, provided under a CC-BY license
Image 1 of 2
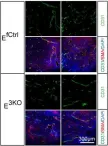
In Elife on 9 August 2016 by Ramo, K., Sugamura, K., et al.
Fig.1.E

-
IF
-
Mus musculus (House mouse)
Collected and cropped from Elife by CiteAb, provided under a CC-BY license
Image 1 of 2