A subset of individuals exposed to Mycobacterium tuberculosis (Mtb) that we refer to as 'resisters' (RSTR) show evidence of IFN-γ- T cell responses to Mtb-specific antigens despite serially negative results on clinical testing. Here we found that Mtb-specific T cells in RSTR were clonally expanded, confirming the priming of adaptive immune responses following Mtb exposure. RSTR CD4+ T cells showed enrichment of TH17 and regulatory T cell-like functional programs compared to Mtb-specific T cells from individuals with latent Mtb infection. Using public datasets, we showed that these TH17 cell-like functional programs were associated with lack of progression to active tuberculosis among South African adolescents with latent Mtb infection and with bacterial control in nonhuman primates. Our findings suggested that RSTR may successfully control Mtb following exposure and immune priming and established a set of T cell biomarkers to facilitate further study of this clinical phenotype.
© 2024. The Author(s).
Product Citations: 37
In Nature Immunology on 1 August 2024 by Sun, M., Phan, J. M., et al.
-
Immunology and Microbiology
In Nature Communications on 5 April 2023 by Pieren, D. K., Kuguel, S. G., et al.
Resident memory T cells (TRM) present at the respiratory tract may be essential to enhance early SARS-CoV-2 viral clearance, thus limiting viral infection and disease. While long-term antigen-specific TRM are detectable beyond 11 months in the lung of convalescent COVID-19 patients, it is unknown if mRNA vaccination encoding for the SARS-CoV-2 S-protein can induce this frontline protection. Here we show that the frequency of CD4+ T cells secreting IFNγ in response to S-peptides is variable but overall similar in the lung of mRNA-vaccinated patients compared to convalescent-infected patients. However, in vaccinated patients, lung responses present less frequently a TRM phenotype compared to convalescent infected individuals and polyfunctional CD107a+ IFNγ+ TRM are virtually absent in vaccinated patients. These data indicate that mRNA vaccination induces specific T cell responses to SARS-CoV-2 in the lung parenchyma, although to a limited extend. It remains to be determined whether these vaccine-induced responses contribute to overall COVID-19 control.
© 2023. The Author(s).
-
FC/FACS
-
COVID-19
-
Genetics
-
Immunology and Microbiology
In Cell Reports Medicine on 21 June 2022 by van der Ploeg, K., Kirosingh, A. S., et al.
Severe acute respiratory syndrome coronavirus 2 (SARS-CoV-2)-specific CD4+ T cells are likely important in immunity against coronavirus 2019 (COVID-19), but our understanding of CD4+ longitudinal dynamics following infection and of specific features that correlate with the maintenance of neutralizing antibodies remains limited. Here, we characterize SARS-CoV-2-specific CD4+ T cells in a longitudinal cohort of 109 COVID-19 outpatients enrolled during acute infection. The quality of the SARS-CoV-2-specific CD4+ response shifts from cells producing interferon gamma (IFNγ) to tumor necrosis factor alpha (TNF-α) from 5 days to 4 months post-enrollment, with IFNγ-IL-21-TNF-α+ CD4+ T cells the predominant population detected at later time points. Greater percentages of IFNγ-IL-21-TNF-α+ CD4+ T cells on day 28 correlate with SARS-CoV-2-neutralizing antibodies measured 7 months post-infection (⍴ = 0.4, p = 0.01). mRNA vaccination following SARS-CoV-2 infection boosts both IFNγ- and TNF-α-producing, spike-protein-specific CD4+ T cells. These data suggest that SARS-CoV-2-specific, TNF-α-producing CD4+ T cells may play an important role in antibody maintenance following COVID-19.
Copyright © 2022 The Author(s). Published by Elsevier Inc. All rights reserved.
-
COVID-19
-
Immunology and Microbiology
In International Journal of Molecular Sciences on 11 March 2022 by Kowalska, W., Zarobkiewicz, M., et al.
Monocytes are one of the least studied immune cells with a potentially important role in the pathogenesis of chronic lymphocytic leukemia (CLL). Nevertheless, data regarding the role of subpopulations of monocytes in the CLL microenvironment are still limited. For the very first time, this study presents an assessment of monocyte subsets divided according to SLAN and CD16 expression in CLL patients. The study involved 70 freshly diagnosed CLL patients and 35 healthy donors. Using flow cytometry, monocyte subpopulations were assessed among PBMCs. CD14+ monocytes can be divided into: "classical" (CD14+CD16-SLAN-), "intermediate" (CD14+CD16+SLAN-) and "non-classical" (CD14dimCD16+SLAN+). In our study, we noted an increased percentage of non-classical monocytes with intracellular expression of TNF and IL-12. On the other hand, among the intermediate monocytes, a significantly higher percentage of cells synthesizing anti-inflammatory IL-10 was detected. The percentage of CD14dimCD16+SLAN+ monocytes producing TNF and IL-12 decreased with the stage of CLL and inversely correlated with the expression of the prognostic factors ZAP-70 and CD38. Moreover, the percentage of CD14dimCD16+SLAN+ monocytes producing TNF and IL-12 was lower in CLL patients requiring treatment. This may indicate the beneficial effect of non-classical monocytes on the anti-tumor response.
-
FC/FACS
-
Homo sapiens (Human)
-
Immunology and Microbiology
Pneumococcal Extracellular Vesicles Modulate Host Immunity.
In mBio on 31 August 2021 by Yerneni, S. S., Werner, S., et al.
Extracellular vesicles (EVs) have recently garnered attention for their participation in host-microbe interactions in pneumococcal infections. However, the effect of EVs on the host immune system remain poorly understood. Our studies focus on EVs produced by Streptococcus pneumoniae (pEVs), and reveal that pEVs are internalized by macrophages, T cells, and epithelial cells. In vitro, pEVs induce NF-κB activation in a dosage-dependent manner and polarize human macrophages to an alternative (M2) phenotype. In addition, pEV pretreatment conditions macrophages to increase bacteria uptake and such macrophages may act as a reservoir for pneumococcal cells by increasing survival of the phagocytosed bacteria. When administered systemically in mice, pEVs induce cytokine release; when immobilized locally, they recruit lymphocytes and macrophages. Taken together, pEVs emerge as critical contributors to inflammatory responses and tissue damage in mammalian hosts. IMPORTANCE Over the last decade, pathogen-derived extracellular vesicles (EVs) have emerged as important players in several human diseases. Therefore, a thorough understanding of EV-mediated mechanisms could provide novel insights into vaccine/therapeutic development. A critical question in the field is: do pathogen-derived EVs help the pathogen evade the harsh environment in the host or do they help the host to mount a robust immune response against the pathogen? This study is a step towards answering this critical question for the Gram-positive pathogen, Streptococcus pneumoniae. Our study shows that while S. pneumoniae EVs (pEVs) induce inflammatory response both in vitro and in vivo, they may also condition the host macrophages to serve as a reservoir for the bacteria.
-
Immunology and Microbiology
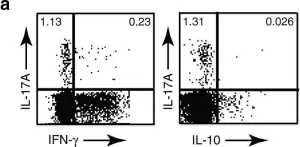
In Nat Commun on 17 November 2017 by Hu, D., Notarbartolo, S., et al.
Fig.1.A

-
FC/FACS
-
Homo sapiens (Human)
Collected and cropped from Nat Commun by CiteAb, provided under a CC-BY license
Image 1 of 1