In vitro models of neuronal aging and gene manipulation in human neurons (hNeurons) are valuable tools for investigating human brain aging and diseases. Here, we present a protocol for applying human embryonic stem cell (hESC)-derived neurons to model aging and the further application of small interfering RNA (siRNA)-mediated gene silencing for functional investigations. We describe steps for neuronal differentiation and culture, siRNA transfection, and technical considerations to ensure reproducibility. Our protocol enables investigations of the molecular mechanism underlying neuronal aging and facilitates drug evaluation. For complete details on the use and execution of this protocol, please refer to Zhang et al.1.
Copyright © 2025 The Author(s). Published by Elsevier Inc. All rights reserved.
Product Citations: 5
In STAR Protocols on 21 March 2025 by Zhang, H., Sun, S., et al.
-
Neuroscience
-
Stem Cells and Developmental Biology
MAVS Antagonizes Human Stem Cell Senescence as a Mitochondrial Stabilizer.
In Research (Washington, D.C.) on 31 July 2023 by Wang, C., Yang, K., et al.
Mitochondrial dysfunction is a hallmark feature of cellular senescence and organ aging. Here, we asked whether the mitochondrial antiviral signaling protein (MAVS), which is essential for driving antiviral response, also regulates human stem cell senescence. To answer this question, we used CRISPR/Cas9-mediated gene editing and directed differentiation techniques to generate various MAVS-knockout human stem cell models. We found that human mesenchymal stem cells (hMSCs) were sensitive to MAVS deficiency, as manifested by accelerated senescence phenotypes. We uncovered that the role of MAVS in maintaining mitochondrial structural integrity and functional homeostasis depends on its interaction with the guanosine triphosphatase optic atrophy type 1 (OPA1). Depletion of MAVS or OPA1 led to the dysfunction of mitochondria and cellular senescence, whereas replenishment of MAVS or OPA1 in MAVS-knockout hMSCs alleviated mitochondrial defects and premature senescence phenotypes. Taken together, our data underscore an uncanonical role of MAVS in safeguarding mitochondrial homeostasis and antagonizing human stem cell senescence.
Copyright © 2023 Cui Wang et al.
-
Cell Biology
-
Stem Cells and Developmental Biology
Genome-wide R-loop Landscapes during Cell Differentiation and Reprogramming.
In Cell Reports on 7 July 2020 by Yan, P., Liu, Z., et al.
DNA:RNA hybrids play key roles in both physiological and disease states by regulating chromatin and genome organization. Their homeostasis during cell differentiation and cell plasticity remains elusive. Using an isogenic human stem cell platform, we systematically characterize R-loops, DNA methylation, histone modifications, and chromatin accessibility in pluripotent cells and their lineage-differentiated derivatives. We confirm that a portion of R-loops formed co-transcriptionally at pluripotency genes in pluripotent stem cells and at lineage-controlling genes in differentiated lineages. Notably, a subset of R-loops maintained after differentiation are associated with repressive chromatin marks on silent pluripotency genes and undesired lineage genes. Moreover, in reprogrammed pluripotent cells, cell-of-origin-specific R-loops are initially present but are resolved with serial passaging. Our analysis suggests a multifaceted role of R-loops in cell fate determination that may serve as an additional layer of modulation on cell fate memory and cell plasticity.
Copyright © 2020 The Author(s). Published by Elsevier Inc. All rights reserved.
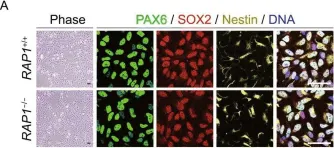
Telomere-dependent and telomere-independent roles of RAP1 in regulating human stem cell homeostasis.
In Protein Cell on 1 September 2019 by Zhang, X., Liu, Z., et al.
RAP1 is a well-known telomere-binding protein, but its functions in human stem cells have remained unclear. Here we generated RAP1-deficient human embryonic stem cells (hESCs) by using CRISPR/Cas9 technique and obtained RAP1-deficient human mesenchymal stem cells (hMSCs) and neural stem cells (hNSCs) via directed differentiation. In both hMSCs and hNSCs, RAP1 not only negatively regulated telomere length but also acted as a transcriptional regulator of RELN by tuning the methylation status of its gene promoter. RAP1 deficiency enhanced self-renewal and delayed senescence in hMSCs, but not in hNSCs, suggesting complicated lineage-specific effects of RAP1 in adult stem cells. Altogether, these results demonstrate for the first time that RAP1 plays both telomeric and nontelomeric roles in regulating human stem cell homeostasis.
-
ICC
-
ICC-IF
-
Homo sapiens (Human)
-
Stem Cells and Developmental Biology
In Cell Reports on 7 August 2018 by Hauser, M., Yan, R., et al.
Through three-dimensional STORM super-resolution microscopy, we resolve the spectrin-actin-based membrane cytoskeleton of neural stem cells (NSCs) and NSC-derived neurons, astrocytes, and oligodendrocytes. We show that undifferentiated NSCs are capable of forming patches of locally periodic, one-dimensional (1D) membrane cytoskeleton with ∼180 nm periodicity. Such periodic structures become increasingly ordered and long-ranging as the NSCs mature into terminally differentiated neuronal and glial cell types, and, during this process, distinct 1D periodic "strips" dominate the flat 2D membranes. Moreover, we report remarkable alignment of the periodic cytoskeletons between abutting cells at axon-axon and axon-oligodendrocyte contacts and identify two adhesion molecules, neurofascin and L1CAM, as candidates to drive this nanoscale alignment. We thus show that a conserved 1D periodic membrane cytoskeletal motif serves as a nanoscale scaffold and ruler to mediate the physical interactions between cell types of the NSC lineage.
Copyright © 2018 The Author(s). Published by Elsevier Inc. All rights reserved.
-
ICC-IF
-
Rattus norvegicus (Rat)
-
Cell Biology
-
Stem Cells and Developmental Biology
In Protein Cell on 1 September 2019 by Zhang, X., Liu, Z., et al.
Fig.5.A

-
ICC
-
Homo sapiens (Human)
Collected and cropped from Protein Cell by CiteAb, provided under a CC-BY license
Image 1 of 1