Despite extensive research and intensive use of chemotherapies in clinics, the 5-year overall survival of acute myeloid leukemia (AML) patients does not exceed 20%. The clonal expansion of leukemic blasts leads to modifications of the bone marrow physical properties, including increased extracellular matrix stiffening, upregulation of intramedullary pressure and reduction of the space available for cells. These biomechanical modifications are speculated to alter therapeutic response and cause treatment resistance. To address this, we herein focused on the role of mechanotransduction pathways in AML. Analysis of primary AML samples or cell lines revealed that BMPR1B and TAZ/TEAD but not YAP levels were higher after patient relapse or in cells resistant to cytarabine or venetoclax. In addition, highly confined resident mesenchymal stem cells expressed higher levels of BMP4, which in turn specifically activated AML-resistant cells. In these cells, TAZ expression was associated with improved adhesion to microenvironmental components and increased intrinsic deformability. Finally, using a 3D human bone marrow-like model, we showed that targeting BMPR1B or TAZ/TEAD in combination with cytarabine impaired persistence of AML primary cells within the AML niche. Future therapeutic approaches could involve BMPR1B and/or TAZ/TEAD targeting in the context of AML patients refractory to chemotherapy or after relapse.
© 2026. The Author(s).
Product Citations: 78
In Leukemia on 18 March 2026 by Barral, L., Lespinasse, N., et al.
-
FC/FACS
-
Cancer Research
In Nature Medicine on 1 February 2026 by Sriranjan-Rothwell, R. S., Zhao, T. X., et al.
Regulatory T (Treg) cells are powerful endogenous modulators of the immune response and their levels are reduced in patients with acute coronary syndromes (ACSs). Low-dose interleukin-2 (IL-2) has been shown to increase Treg cell levels, potentially providing an immunomodulatory strategy in ACSs. The IVORY trial was a double-blind, placebo-controlled, phase 2 trial in which patients presenting with ACSs and high-sensitivity C-reactive protein levels >2 mg l-1 were randomized in a 1:1 ratio to receive subcutaneous low-dose IL-2 (1.5 × 10⁶ IU) or placebo for 8 weeks. [18F]Fluorodeoxyglucose positron emission tomography-computed tomography of the ascending aorta and carotid arteries was performed before and after treatment. Here the primary outcome was the difference in arterial inflammation in the index vessel (the vessel with the highest average maximum target-to-background ratio pre-treatment) on follow-up imaging between the two groups (placebo = 29 (female-to-male ratio (F-to-M) = 6:23); low-dose IL-2 = 31 (F-to-M = 3:28)). At the end of treatment, arterial inflammation was -0.171 (-7.7%) lower in the low-dose IL-2 group compared to the placebo group (95% confidence interval -0.308 to -0.034, P = 0.015). In secondary efficacy analyses, the difference in arterial inflammation between the low-dose IL-2 and placebo groups was greater (-8.3%, P = 0.009) in more inflamed segments and low-dose IL-2 treatment increased Treg cell levels compared to placebo (P < 0.0001). Low-dose IL-2 treatment appeared to be safe, with no major adverse cardiovascular events at the 2-year follow-up, compared to three patients with such events in the placebo group. In conclusion, in patients with ACSs, low-dose IL-2 safely increases Treg cell levels and reduces arterial inflammation. The clinical benefit of low-dose IL-2 requires validation in larger studies. ClinicalTrials.gov registration: NCT04241601 .
© 2026. The Author(s).
-
Homo sapiens (Human)
-
Immunology and Microbiology
In Nature Communications on 8 January 2026 by Spiga, M., Potenza, A., et al.
T-cell avidity is a major determinant of Adoptive T cell therapy (ACT) efficacy for cancer treatment. However, high-avidity tumor-specific T cells can rarely be isolated from cancer patients, highlighting the need for strategies to enhance the cytotoxic capacity of low-avidity cells. Here, we rescue the anti-tumor functions of low-avidity T cells against pancreatic ductal adenocarcinoma (PDAC) by knocking-out TIGIT, a key inhibitory molecule expressed on exhausted CD8+ T cells infiltrating gastrointestinal tumors. We uncover that TIGIT disruption by base editing boosts the intracellular signal transduction derived from a weak T cell receptor (TCR) engagement enforcing cytoskeletal rearrangements, thus increasing T cell avidity and stabilizing the immunological synapse. Accordingly, TIGIT disruption enables low-avidity T cells to exert robust degranulation, comparable to that of high-avidity T cells, and potent and durable anti-tumor capacity in vivo in male mice. These results highlight TIGIT knockout as a potential strategy to enhance low-avidity T cell function and broaden the repertoire of TCR engineered T cells in the treatment of pancreatic cancer and other solid malignancies.
© 2026. The Author(s).
-
Immunology and Microbiology
In Nature Communications on 18 November 2025 by Chen, L., Bian, Y., et al.
Myelodysplastic syndrome (MDS) is characterized by bone marrow failure, clonal evolution and leukemic progression, but the pathophysiologic processes driving these events remain incompletely understood. Here, by establishing a comprehensive single-cell transcriptional taxonomy of human MDS, we reveal that inflammatory remodeling of bone marrow stromal niches is a common early feature, irrespective of the genetic driver landscape. We identify an activated CD8-T-cell subset as a source of stromal inflammation via TNF-receptor signaling, which prompts the inflammatory rewiring and loss of repopulating ability of residual normal hematopoietic stem/progenitor cells (HSPC). Mutant HSPCs display relative resistance to this inflammatory stress and reside predominantly in a transcriptional 'high output' state, providing a biological framework to their competitive advantage in an inflammatory microenvironment. Consistent with this, stromal inflammation associates with leukemic progression and reduced survival. Our data thus support a model of immune-stromal inflammatory signaling driving tissue failure and clonal evolution in the hematopoietic system. Mechanisms of clonal evolution in myeloid neoplasms remain incompletely understood. Darwinian theory predicts that the (micro)environment of clone-propagating stem cells may contribute to clonal selection. Here, we provide data fitting this model, establishing a relationship between stromal niche inflammation, inflammatory stress in HSPCs, clonal resistance and leukemic evolution in human MDS.
© 2025. The Author(s).
-
Immunology and Microbiology
In Nature Communications on 6 November 2025 by Deming, M., Toapanta, F. R., et al.
Mucosal influenza vaccines may provide improved protection against infection and transmission, but their development is hindered by absence of immune correlates of protection. Here, we report a randomized, controlled phase I trial of a recombinant influenza A/H5 (A/Indonesia/05/2005, clade 2.1) hemagglutinin vaccine formulated with a nanoemulsion adjuvant (W805EC). The vaccine is administered intranasally in two doses 28 days apart at three antigen levels. Controls receive unadjuvanted H5 or placebo. Six months later, participants receive an intramuscular boost with unadjuvanted inactivated A/H5N1 (A/Vietnam/1203/2004, clade 1) vaccine. Primary outcomes are solicited and unsolicited adverse events (AEs), laboratory safety abnormalities, medically-attended AEs, potential immune-mediated conditions, new-onset chronic conditions, and serious AEs. All vaccines are well tolerated. After the intranasal series, hemagglutination inhibition and microneutralization responses are minimal. However, adjuvanted H5 recipients show significant increases in mucosal and serum IgG/IgA, surface plasmon resonance antibody binding, memory B and CD4 T cell activity, and antibody-dependent cell-mediated cytotoxicity. Following H5N1 boost, participants mount robust responses across measurements and have microneutralization responses against diverse H5N1 clades (including circulating clade 2.3.4.4b). Findings demonstrate successful mucosal priming and broad cross-clade responses. This intranasal vaccine supports further exploration of mucosal immune biomarkers and may accelerate development of intranasal influenza vaccines. ClinicalTrials.gov registration: NCT05397119.
© 2025. The Author(s).
-
Immunology and Microbiology
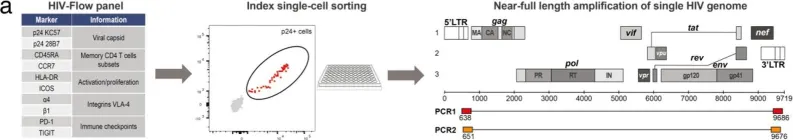
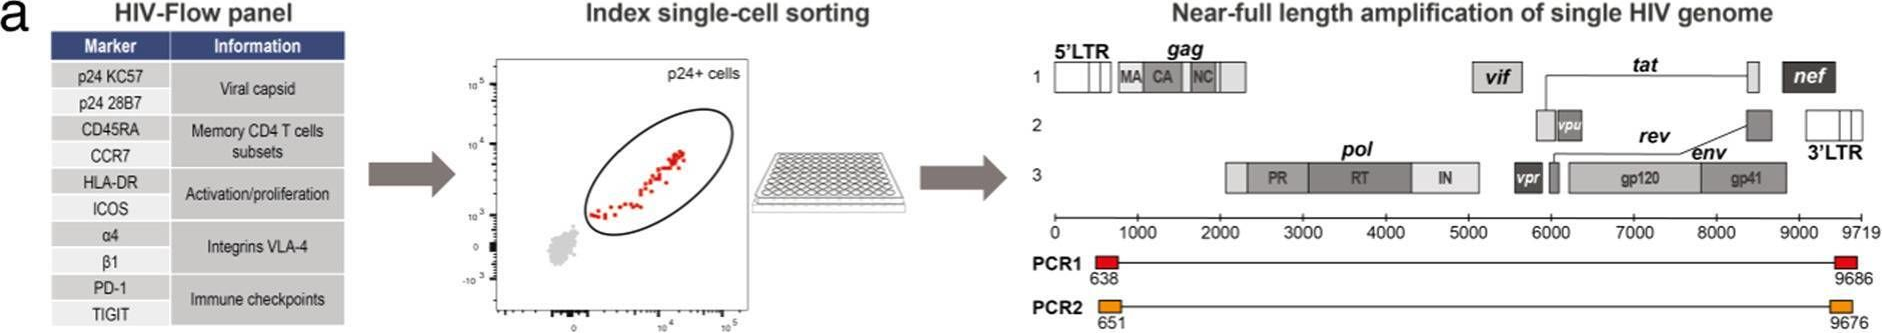
In Nat Commun on 27 February 2023 by Dufour, C., Richard, C., et al.
Fig.1.A
-
WB
-
Collected and cropped from Nature Communications by CiteAb, provided under a CC-BY license
Image 1 of 8
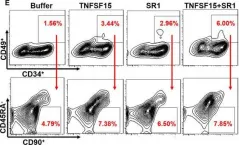
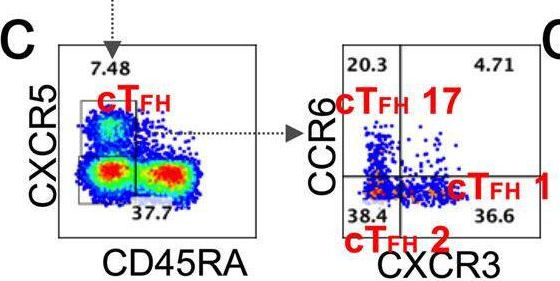
In Signal Transduct Target Ther on 23 April 2022 by Wang, Z., Yang, X., et al.
Fig.5.A

-
FC/FACS
-
Collected and cropped from Signal Transduction and Targeted Therapy by CiteAb, provided under a CC-BY license
Image 1 of 8
In Signal Transduct Target Ther on 23 April 2022 by Wang, Z., Yang, X., et al.
Fig.5.C
-
FC/FACS
-
Collected and cropped from Signal Transduction and Targeted Therapy by CiteAb, provided under a CC-BY license
Image 1 of 8
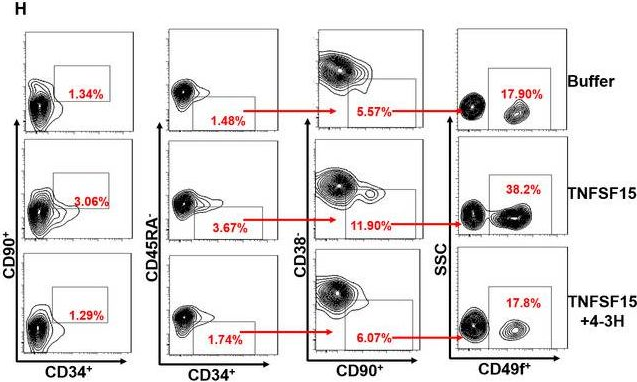
In J Cell Mol Med on 1 October 2020 by Ding, Y., Gao, S., et al.
Fig.1.H
-
FC/FACS
-
Homo sapiens (Human)
Collected and cropped from Journal of Cellular and Molecular Medicine by CiteAb, provided under a CC-BY license
Image 1 of 8
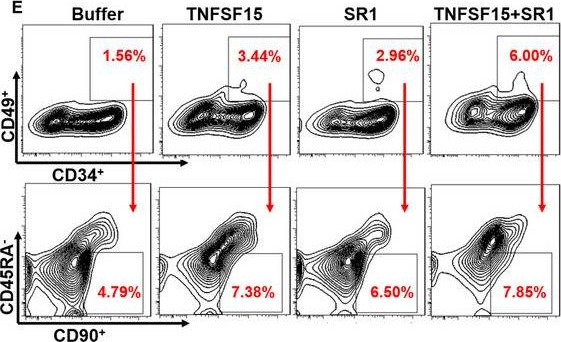
In J Cell Mol Med on 1 October 2020 by Ding, Y., Gao, S., et al.
Fig.3.E
-
FC/FACS
-
Homo sapiens (Human)
Collected and cropped from Journal of Cellular and Molecular Medicine by CiteAb, provided under a CC-BY license
Image 1 of 8
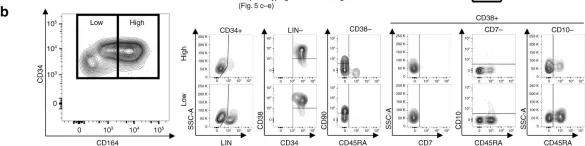
In Nat Commun on 3 June 2019 by Pellin, D., Loperfido, M., et al.
Fig.5.B
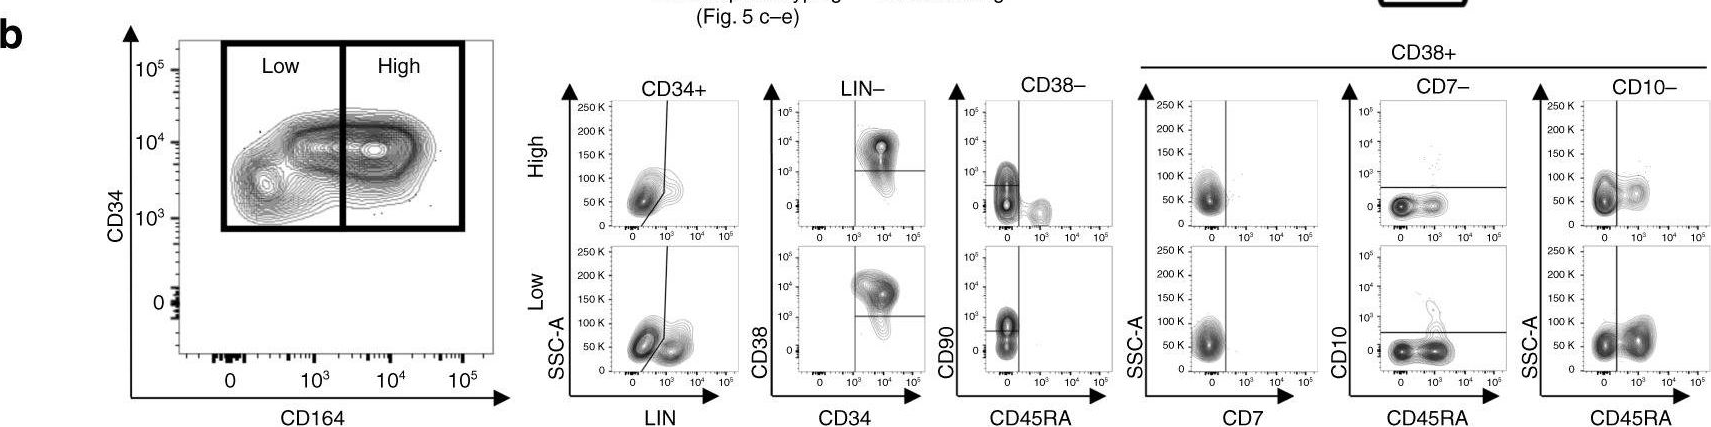
-
FC/FACS
-
Homo sapiens (Human)
Collected and cropped from Nature Communications by CiteAb, provided under a CC-BY license
Image 1 of 8
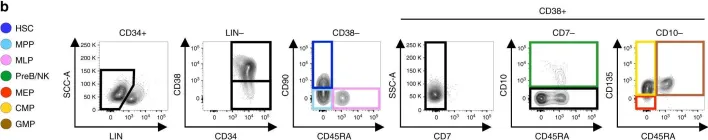
In Nat Commun on 3 June 2019 by Pellin, D., Loperfido, M., et al.
Fig.1.B
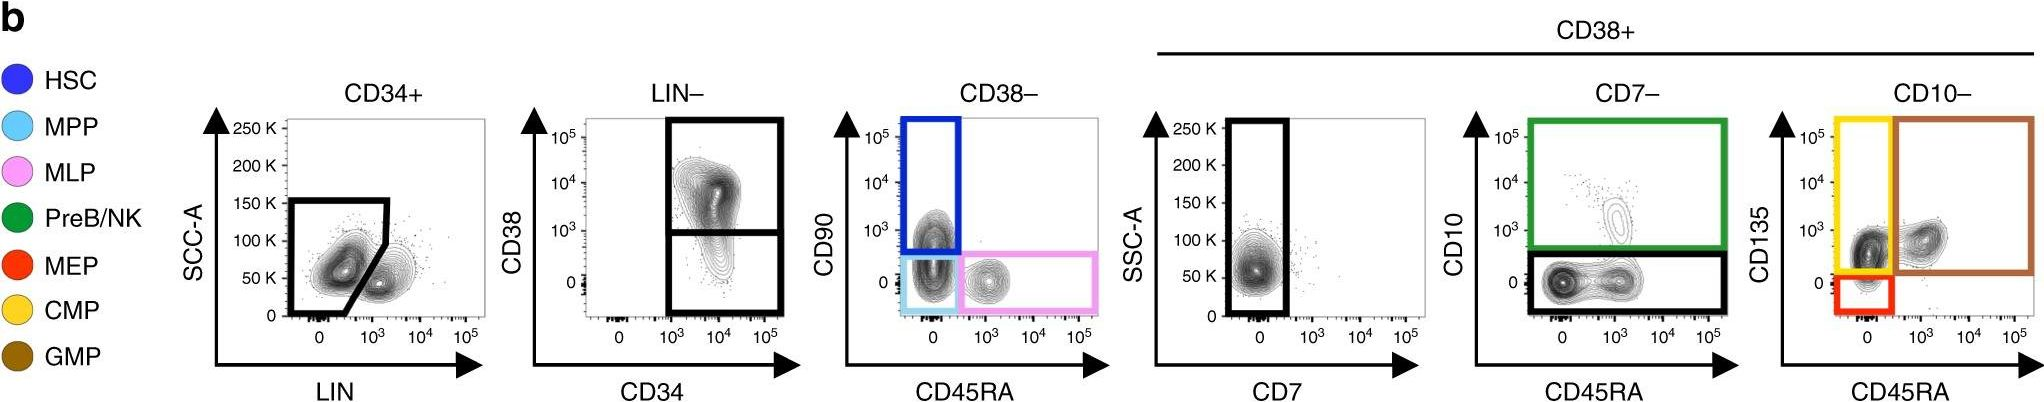
-
FC/FACS
-
Homo sapiens (Human)
Collected and cropped from Nature Communications by CiteAb, provided under a CC-BY license
Image 1 of 8
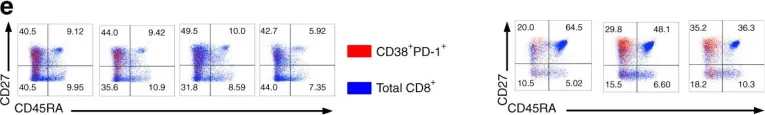
In Nat Commun on 26 February 2018 by Wang, Z., Zhu, L., et al.
Fig.2.E
-
FC/FACS
-
Homo sapiens (Human)
Collected and cropped from Nature Communications by CiteAb, provided under a CC-BY license
Image 1 of 8