The translocation t(14;18) activates BCL2 and is considered the initiating genetic lesion in most follicular lymphomas (FL). Surprisingly, FL patients fail to respond to the BCL2 inhibitor, Venetoclax. We show that mutations and deletions affecting the histone lysine methyltransferase SETD1B (KMT2G) occur in 7% of FLs and 16% of diffuse large B cell lymphomas (DLBCL). Deficiency in SETD1B confers striking resistance to Venetoclax and an experimental MCL-1 inhibitor. SETD1B also acts as a tumor suppressor and cooperates with the loss of KMT2D in lymphoma development in vivo. Consistently, loss of SETD1B in human lymphomas typically coincides with loss of KMT2D. Mechanistically, SETD1B is required for the expression of several proapoptotic BCL2 family proteins. Conversely, inhibitors of the KDM5 histone H3K4 demethylases restore BIM and BIK expression and synergize with Venetoclax in SETD1B-deficient lymphomas. These results establish SETD1B as an epigenetic regulator of cell death and reveal a pharmacological strategy to augment Venetoclax sensitivity in lymphoma.
© 2024 Portelinha et al.
Product Citations: 12
SETD1B mutations confer apoptosis resistance and BCL2 independence in B cell lymphoma.
In The Journal of Experimental Medicine on 7 October 2024 by Portelinha, A., Wang, S., et al.
-
FC/FACS
-
Cancer Research
-
Immunology and Microbiology
Moderate Aerobic Exercise Induces Homeostatic IgA Generation in Senile Mice.
In International Journal of Molecular Sciences on 27 July 2024 by Hernández-Urbán, A. J., Drago-Serrano, M. E., et al.
A T-cell-independent (TI) pathway activated by microbiota results in the generation of low-affinity homeostatic IgA with a critical role in intestinal homeostasis. Moderate aerobic exercise (MAE) provides a beneficial impact on intestinal immunity, but the action of MAE on TI-IgA generation under senescence conditions is unknown. This study aimed to determine the effects of long-term MAE on TI-IgA production in young (3 month old) BALB/c mice exercised until adulthood (6 months) or aging (24 months). Lamina propria (LP) from the small intestine was obtained to determine B cell and plasma cell sub-populations by flow cytometry and molecular factors related to class switch recombination [Thymic Stromal Lymphopoietin (TSLP), A Proliferation-Inducing Ligand (APRIL), B Cell Activating Factor (BAFF), inducible nitric oxide synthase (iNOS), and retinal dehydrogenase (RDH)] and the synthesis of IgA [α-chain, interleukin (IL)-6, IL-21, and Growth Factor-β (TGF-β)]; and epithelial cells evaluated IgA transitosis [polymeric immunoglobulin receptor (pIgR), tumor necrosis factor-α (TNF-α), interferon-γ (IFN-γ), IL-4] by the RT-qPCR technique. The results were compared with data obtained from sedentary age-matched mice. Statistical analysis was computed with ANOVA, and p < 0.05 was considered to be a statistically significant difference. Under senescence conditions, MAE promoted the B cell and IgA+ B cells and APRIL, which may improve the intestinal response and ameliorate the inflammatory environment associated presumably with the downmodulation of pro-inflammatory mediators involved in the upmodulation of pIgR expression. Data suggested that MAE improved IgA and downmodulate the cytokine pro-inflammatory expression favoring homeostatic conditions in aging.
Moderate Aerobic Exercise Induces the Homeostatic IgA Generation in Senile Mice
Preprint on Preprints.org on 17 June 2024 by Hernández-Urbán, A. J., Drago-Serrano, M., et al.
T-cell independent (TI) pathway activated by microbiota results in the generation of low-affinity homeostatic IgA with a critical role in intestinal homeostasis. Moderate aerobic exercise (MAE) provides a beneficial impact on intestinal immunity but the action of MAE on TI-IgA generation under senescence conditions is unknown. This study aimed to determine the effects of long-term MAE on TI-IgA production in young (3 months old) BALB/c mice exercised until adulthood (6 months) or aging (24 months). Lamina propria (LP) from the small intestine was obtained to determine B cells and plasma cells sub-populations by flow cytometry and molecular factors related to class switch recombination (TSLP/APRIL/BAFF/iNOS/RDH) and synthesis of IgA (α-chain/IL-6/IL-21/TGF-β); and epithelial cells to evaluate IgA-transitosis (pIgR/TNFα/IFN-/IL-4), by RT-qPCR technique. Results were compared with data obtained from sedentary age-matched mice. Statistical analysis was computed with ANDOVA and P<0.05 was considered as statistically significant difference. Under senescence conditions MAE promoted the B cell and IgA+B cells and APRIL that may im-prove the intestinal response and ameliorated the inflammatory environment associated pre-sumably with the downmodulation of pIgR. Data suggested that MAE improved the IgA and downmodulate the cytokine pro-inflammatory expression favoring homeostatic conditions in aging.
In Frontiers in Immunology on 3 August 2021 by Jang, A., Sharp, R., et al.
The production of autoantibodies by autoreactive B cells plays a major role in the pathogenesis of lupus. Increases in memory B cells have been observed in human lupus patients and autoimmune lpr mice. Autophagy is required for the maintenance of memory B cells against viral infections; however, whether autophagy regulates the persistence of autoantigen-specific memory B cells and the development of lupus remains to be determined. Here we show that memory B cells specific for autoantigens can be detected in autoimmune lpr mice and a pristane-induced lupus mouse model. Interestingly, B cell-specific deletion of Atg7 led to significant loss of autoreactive memory B cells and reduced autoantibody production in pristane-treated mice. Autophagy deficiency also attenuated the development of autoimmune glomerulonephritis and pulmonary inflammation after pristane treatment. Adoptive transfer of wild type autoreactive memory B cells restored autoantibody production in Atg7-deficient recipients. These data suggest that autophagy is important for the persistence of autoreactive memory B cells in mediating autoantibody responses. Our results suggest that autophagy could be targeted to suppress autoreactive memory B cells and ameliorate humoral autoimmunity.
Copyright © 2021 Jang, Sharp, Wang, Feng, Wang and Chen.
-
Cell Biology
-
Immunology and Microbiology
In Nature Communications on 2 October 2019 by Wu, Y., Song, Z., et al.
The use of an endogenous stimulus instead of external trigger has an advantage for targeted and controlled release in drug delivery. Here, we report on cascade nanoreactors for bacterial toxin-triggered antibiotic release by wrapping calcium peroxide (CaO2) and antibiotic in a eutectic mixture of two fatty acids and a liposome coating. When encountering pathogenic bacteria in vivo these nanoreactors capture the toxins, without compromising their structural integrity, and the toxins form pores. Water enters the nanoreactors through the pores to react with CaO2 and produce hydrogen peroxide which decomposes to oxygen and drives antibiotic release. The bound toxins reduce the toxicity and also stimulate the body's immune response. This works to improve the therapeutic effect in bacterially infected mice. This strategy provides a Domino Effect approach for treating infections caused by bacteria that secrete pore-forming toxins.
-
FC/FACS
-
Mus musculus (House mouse)
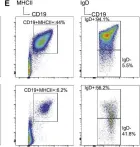
In Mol Cell on 17 May 2018 by Bellelli, R., Borel, V., et al.
Fig.2.E

-
FC/FACS
-
Mus musculus (House mouse)
Collected and cropped from Mol Cell by CiteAb, provided under a CC-BY license
Image 1 of 2
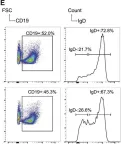
In Mol Cell on 17 May 2018 by Bellelli, R., Borel, V., et al.
Fig.6.E

-
FC/FACS
-
Mus musculus (House mouse)
Collected and cropped from Mol Cell by CiteAb, provided under a CC-BY license
Image 1 of 2