High-grade complex karyotype sarcomas are a heterogeneous group of tumors with a uniformly poor prognosis. Within complex karyotype sarcomas, there are innumerable genetic changes but identifying those that are clinically relevant has been challenging.
To address this, we utilized a pooled genetic screening approach, informed by The Cancer Genome Atlas (TCGA) data, to identify key drivers and modifiers of sarcoma development that were validated in vivo.
YAP1 and wild-type KRAS were validated as drivers and transformed human mesenchymal stem cells into two distinct sarcoma subtypes, undifferentiated pleomorphic sarcoma and myxofibrosarcoma, respectively. A subset of tumors driven by CDK4 and PIK3CA reflected leiomyosarcoma and osteosarcoma demonstrating the plasticity of this approach and the potential to investigate sarcoma subtype heterogeneity. All generated tumors histologically reflected human sarcomas and had increased aneuploidy as compared to simple karyotype sarcomas. Comparing differential gene expression of TCGA samples to model data identified increased oxidative phosphorylation signaling in YAP1 tumors. Treatment of a panel of soft tissue sarcomas with a combination of YAP1 and oxidative phosphorylation inhibitors led to significantly decreased viability.
Transcriptional co-analysis of TCGA patient samples to YAP1 and KRAS model tumors supports that these sarcoma subtypes lie along a spectrum of disease and adds guidance for further transcriptome-based refinement of sarcoma subtyping. This approach can be used to begin to understand pathways and mechanisms driving human sarcoma development, the relationship between sarcoma subtypes, and to identify and validate new therapeutic vulnerabilities for this aggressive and heterogeneous disease.
©2024 American Association for Cancer Research.
Product Citations: 14
In Clinical Cancer Research on 1 November 2024 by Freeland, J., Muñoz, M., et al.
-
Cancer Research
-
Genetics
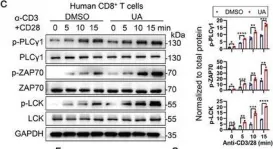
Urolithin A Hijacks ERK1/2-ULK1 Cascade to Improve CD8+ T Cell Fitness for Antitumor Immunity.
In Advanced Science (Weinheim, Baden-Wurttemberg, Germany) on 1 May 2024 by Ma, S., Wu, Q., et al.
According to the latest evidence, the microbial metabolite Urolithin A (UA), known for its role in promoting cellular health, modulates CD8+ T cell-mediated antitumor activity. However, the direct target protein of UA and its underlying mechanism remains unclear. Here, this research identifies ERK1/2 as the specific target crucial for UA-mediated CD8+ T cell activation. Even at low doses, UA markedly enhances the persistence and effector functions of primary CD8+ cytotoxic T lymphocytes (CTLs) and human chimeric antigen receptor (CAR) T cells both in vitro and in vivo. Mechanistically, UA interacts directly with ERK1/2 kinases, enhancing their activation and subsequently facilitating T cell activation by engaging ULK1. The UA-ERK1/2-ULK1 axis promotes autophagic flux in CD8+ CTLs, enhancing cellular metabolism and maintaining reactive oxygen species (ROS) levels, as evidenced by increased oxygen consumption and extracellular acidification rates. UA-treated CD8+ CTLs also display elevated ATP levels and enhanced spare respiratory capacity. Overall, UA activates ERK1/2, inducing autophagy and metabolic adaptation, showcasing its potential in tumor immunotherapy and interventions for diseases involving ERKs.
© 2024 The Authors. Advanced Science published by Wiley‐VCH GmbH.
-
WB
-
Immunology and Microbiology
Preprint on BioRxiv : the Preprint Server for Biology on 14 February 2024 by Roscioli, E., Galli Fonseca, V. Z., et al.
SUMMARY The silent pandemic caused by antimicrobial resistance (AMR) requires innovative therapeutic approaches. Human monoclonal antibodies (mAbs), which are among the most transformative, safe and effective drugs in oncology and autoimmunity, are rarely used for infectious diseases and not yet used for AMR. Here we applied an antigen-agnostic strategy to isolate extremely potent human mAbs against Klebsiella pneumoniae (Kp) sequence type 147 (ST147), a hypervirulent and pandrug-resistant clonotype which is spreading globally. Isolated mAbs target the bacterial capsule and the O-antigen. Surprisingly, although both capsule- and O-antigen-specific mAbs displayed bactericidal activity in the picomolar range in vitro , only the capsule-specific mAbs were protective against fulminant ST147 bloodstream infection. Protection correlated with in vitro bacterial uptake by macrophages and enchained bacterial growth. Our study describes the only drug able to protect against pandrug-resistant Kp and provides a strategy to isolate mAbs and identify correlates of protection against AMR bacteria.
In situ correction of various β-thalassemia mutations in human hematopoietic stem cells.
In Frontiers in Cell and Developmental Biology on 9 February 2024 by Yang, Y., He, L., et al.
β-thalassemia (β-thal) is the most common monogenic disorder caused by various mutations in the human hemoglobin β (HBB) gene and affecting millions of people worldwide. Electroporation of Cas9 and single-guide RNA (sgRNA)-ribonucleoprotein (RNP) complex-mediated gene targeting in patient-derived hematopoietic stem cells (HSCs), followed by autologous transplantation, holds the promise to cure patients lacking a compatible bone marrow donor. In this study, a universal gene correction method was devised to achieve in situ correction of most types of HBB mutations by using validated CRISPR/sgRNA-RNP complexes and recombinant adeno-associated viral 6 (rAAV6) donor-mediated homology-directed repair (HDR) in HSCs. The gene-edited HSCs exhibited multi-lineage formation abilities, and the expression of β-globin transcripts was restored in differentiated erythroid cells. The method was applied to efficiently correct different mutations in β-thal patient-derived HSCs, and the edited HSCs retained the ability to engraft into the bone marrow of immunodeficient NOD-scid-IL2Rg-/- (NSI) mice. This study provides an efficient and safe approach for targeting HSCs by HDR at the HBB locus, which provides a potential therapeutic approach for treating other types of monogenic diseases in patient-specific HSCs.
Copyright © 2024 Yang, He, Xie, Zhu, Wu, Fan, Yang and Sun.
-
Stem Cells and Developmental Biology
In Nature Communications on 7 July 2023 by Fang, A., Wang, Y., et al.
The transplantation of mesenchymal stem cells-derived secretome, particularly extracellular vesicles is a promising therapy to suppress spinal cord injury-triggered neuroinflammation. However, efficient delivery of extracellular vesicles to the injured spinal cord, with minimal damage, remains a challenge. Here we present a device for the delivery of extracellular vesicles to treat spinal cord injury. We show that the device incorporating mesenchymal stem cells and porous microneedles enables the delivery of extracellular vesicles. We demonstrate that topical application to the spinal cord lesion beneath the spinal dura, does not damage the lesion. We evaluate the efficacy of our device in a contusive spinal cord injury model and find that it reduces the cavity and scar tissue formation, promotes angiogenesis, and improves survival of nearby tissues and axons. Importantly, the sustained delivery of extracellular vesicles for at least 7 days results in significant functional recovery. Thus, our device provides an efficient and sustained extracellular vesicles delivery platform for spinal cord injury treatment.
© 2023. The Author(s).
-
Neuroscience
In Adv Sci (Weinh) on 1 May 2024 by Ma, S., Wu, Q., et al.
Fig.1.C

-
WB
-
Collected and cropped from Adv Sci (Weinh) by CiteAb, provided under a CC-BY license
Image 1 of 1