Single-cell RNA sequencing (scRNA-seq) can resolve transcriptional features from individual cells, but scRNA-seq techniques capable of resolving the variable regions of B cell receptors (BCRs) remain limited, especially from widely-used 3'-barcoded libraries. Here, we report a method that can recover paired, full-length variable region sequences of BCRs from 3'-barcoded scRNA-seq libraries. We first verify this method (B3E-seq) can produce accurate, full-length BCR sequences. We then apply this method to profile B cell responses elicited against the capsular polysaccharide of Streptococcus pneumoniae serotype 3 (ST3) by glycoconjugate vaccines in five infant rhesus macaques. We identify BCR features associated with specificity for the ST3 antigen which are present in multiple vaccinated monkeys, indicating a convergent response to vaccination. These results demonstrate the utility of our method to resolve key features of the B cell repertoire and profile antigen-specific responses elicited by vaccination.
© 2024. The Author(s).
Product Citations: 5
In Communications Biology on 28 September 2024 by Morgan, D. M., Zhang, Y., et al.
-
Genetics
A partial human LCK defect causes a T cell immunodeficiency with intestinal inflammation.
In The Journal of Experimental Medicine on 1 January 2024 by Lui, V. G., Hoenig, M., et al.
Lymphocyte-specific protein tyrosine kinase (LCK) is essential for T cell antigen receptor (TCR)-mediated signal transduction. Here, we report two siblings homozygous for a novel LCK variant (c.1318C>T; P440S) characterized by T cell lymphopenia with skewed memory phenotype, infant-onset recurrent infections, failure to thrive, and protracted diarrhea. The patients' T cells show residual TCR signal transduction and proliferation following anti-CD3/CD28 and phytohemagglutinin (PHA) stimulation. We demonstrate in mouse models that complete (Lck-/-) versus partial (LckP440S/P440S) loss-of-function LCK causes disease with differing phenotypes. While both Lck-/- and LckP440S/P440S mice exhibit arrested thymic T cell development and profound T cell lymphopenia, only LckP440S/P440S mice show residual T cell proliferation, cytokine production, and intestinal inflammation. Furthermore, the intestinal disease in the LckP440S/P440S mice is prevented by CD4+ T cell depletion or regulatory T cell transfer. These findings demonstrate that P440S LCK spares sufficient T cell function to allow the maturation of some conventional T cells but not regulatory T cells-leading to intestinal inflammation.
© 2023 Lui et al.
-
FC/FACS
-
Immunology and Microbiology
Mouse and human antibodies bind HLA-E-leader peptide complexes and enhance NK cell cytotoxicity.
In Communications Biology on 28 March 2022 by Li, D., Brackenridge, S., et al.
The non-classical class Ib molecule human leukocyte antigen E (HLA-E) has limited polymorphism and can bind HLA class Ia leader peptides (VL9). HLA-E-VL9 complexes interact with the natural killer (NK) cell receptors NKG2A-C/CD94 and regulate NK cell-mediated cytotoxicity. Here we report the isolation of 3H4, a murine HLA-E-VL9-specific IgM antibody that enhances killing of HLA-E-VL9-expressing cells by an NKG2A+ NK cell line. Structural analysis reveal that 3H4 acts by preventing CD94/NKG2A docking on HLA-E-VL9. Upon in vitro maturation, an affinity-optimized IgG form of 3H4 showes enhanced NK killing of HLA-E-VL9-expressing cells. HLA-E-VL9-specific IgM antibodies similar in function to 3H4 are also isolated from naïve B cells of cytomegalovirus (CMV)-negative, healthy humans. Thus, HLA-E-VL9-targeting mouse and human antibodies isolated from the naïve B cell antibody pool have the capacity to enhance NK cell cytotoxicity.
© 2022. The Author(s).
-
FC/FACS
-
Homo sapiens (Human)
In vitro and in vivo functions of SARS-CoV-2 infection-enhancing and neutralizing antibodies.
In Cell on 5 August 2021 by Li, D., Edwards, R. J., et al.
SARS-CoV-2-neutralizing antibodies (NAbs) protect against COVID-19. A concern regarding SARS-CoV-2 antibodies is whether they mediate disease enhancement. Here, we isolated NAbs against the receptor-binding domain (RBD) or the N-terminal domain (NTD) of SARS-CoV-2 spike from individuals with acute or convalescent SARS-CoV-2 or a history of SARS-CoV infection. Cryo-electron microscopy of RBD and NTD antibodies demonstrated function-specific modes of binding. Select RBD NAbs also demonstrated Fc receptor-γ (FcγR)-mediated enhancement of virus infection in vitro, while five non-neutralizing NTD antibodies mediated FcγR-independent in vitro infection enhancement. However, both types of infection-enhancing antibodies protected from SARS-CoV-2 replication in monkeys and mice. Three of 46 monkeys infused with enhancing antibodies had higher lung inflammation scores compared to controls. One monkey had alveolar edema and elevated bronchoalveolar lavage inflammatory cytokines. Thus, while in vitro antibody-enhanced infection does not necessarily herald enhanced infection in vivo, increased lung inflammation can rarely occur in SARS-CoV-2 antibody-infused macaques.Copyright © 2021 Elsevier Inc. All rights reserved.
-
FC/FACS
-
COVID-19
-
Immunology and Microbiology
A novel human IL2RB mutation results in T and NK cell-driven immune dysregulation.
In The Journal of Experimental Medicine on 3 June 2019 by Fernandez, I. Z., Baxter, R. M., et al.
The pleiotropic actions of interleukin-2 (IL-2) are essential for regulation of immune responses and maintenance of immune tolerance. The IL-2 receptor (IL-2R) is composed of IL-2Rα, IL-2Rβ, and IL-2Rγ subunits, with defects in IL-2Rα and IL-2Rγ and their downstream signaling effectors resulting in known primary immunodeficiency disorders. Here, we report the first human defect in IL-2Rβ, occurring in two infant siblings with a homozygous IL2RB mutation in the WSXWS motif, manifesting as multisystem autoimmunity and susceptibility to CMV infection. The hypomorphic mutation results in diminished IL-2Rβ surface expression and dysregulated IL-2/15 signaling, with an anticipated reduction in regulatory T cells. However, in contrast to the IL-2Rβ-/- animal model, which lacks NK cells, these siblings demonstrate an expansion of NK cells, particularly the CD56bright subset, and a lack of terminally differentiated NK cells. Thus, the early-onset autoimmunity and immunodeficiency are linked to functional deficits arising from altered IL-2Rβ expression and signaling in T and NK cells.
© 2019 Fernandez et al.
-
FC/FACS
-
Immunology and Microbiology
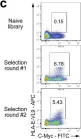
In Commun Biol on 28 March 2022 by Li, D., Brackenridge, S., et al.
Fig.4.C

-
FC/FACS
-
Homo sapiens (Human)
Collected and cropped from Commun Biol by CiteAb, provided under a CC-BY license
Image 1 of 1