The advent of highly refined wheat products has reduced fiber consumption, which is associated with increased risk for inflammatory bowel disease (IBD). We found that enriching diets with wheat fiber (WF) protected mice against colitis, especially relative to a low-fiber diet, as assessed by clinical, histopathologic, morphologic, and immunologic parameters. WF's protection against colitis was independent of short-chain fatty acids (SCFAs) yet associated with preservation of microbiota diversity, including maintenance of Bacteroides thetaiotaomicron (B. theta), which was necessary and sufficient for WF's colitis protection. B. theta's presence in gnotobiotic mice resulted in WF-induced fecal metabolites that reprogrammed macrophages toward an M2-like phenotype. Metabolic and phenotypic reprogramming of macrophages ex vivo via WF-induced metabolites, followed by their transplantation into mice, recapitulated WF's protection against colitis. Thus, microbiota-mediated metabolism of WF promotes macrophages that reduce proneness to intestinal inflammation, suggesting a mechanism by which WF consumption may curb development of IBD.
Product Citations: 33
Wheat fiber mitigates colitis via non-SCFA microbial metabolite-trained intestinal macrophages.
In Science Advances on 27 March 2026 by Kim, S. G., Ott, R., et al.
-
FC/FACS
-
Mus musculus (House mouse)
-
Cell Biology
-
Plant Science
In The Journal of Clinical Investigation on 21 January 2025 by Cui, X., Hou, L., et al.
The bone marrow (BM) niche is critical in regulating hematopoiesis, and sexual dimorphism and its underlying mechanism in the BM niche and its impact on hematopoiesis are not well understood. We show that male mice exhibited a higher abundance of leptin-receptor-expressing mesenchymal stromal cells (LepR-MSCs) compared with female mice. Sex-mismatched coculture and BM transplantation showed that the male BM niche provided superior support for in vitro colony formation and in vivo hematopoietic engraftment. The cotransplantation of male stromal cells significantly enhanced engraftment in female recipients. Single-cell RNA-seq revealed that the lower expression of the X-linked lysine H3K4 demethylase, Kdm5c, in male MSCs led to the increased expression of Cxcl12. In MSC-specific Kdm5c-KO mouse model, the reduction of KDM5C in female MSCs enhanced MSC quantity and function, ultimately improving engraftment to the male level. Kdm5c thus plays a role in driving sexual dimorphism in the BM niche and hematopoietic regeneration. Our study unveils a sex-dependent mechanism governing the BM niche regulation and its impact on hematopoietic engraftment. The finding offers potential implications for enhancing BM transplantation efficacy in clinical settings by harnessing the resource of male MSCs or targeting Kdm5c.
-
FC/FACS
-
Mus musculus (House mouse)
In Emerging Microbes Infections on 1 December 2024 by Zhang, W., Sloan, A., et al.
The nucleoprotein (NP) of type A influenza virus (IAV) is highly conserved across all virus strains, making it an attractive candidate antigen for universal vaccines. While various studies have explored NP-induced mucosal immunity, here we interrogated the mechanistic differences between intramuscular (IM) and intranasal (IN) delivery of a recombinant adenovirus carrying NP fused with a bifunctional CD40 ligand. Despite being less effective than IM delivery in inducing systemic cellular immune responses and antibody-dependent cellular cytotoxicity (ADCC), IN immunization elicited superior antigen-specific recall humoral and cellular response in the nasal associated lymphoid tissue (NALT) of the upper respiratory tract, the initial site of immune recognition and elimination of inhaled pathogens. IN vaccination also induced significantly stronger pulmonary T cell responses in the lower respiratory tract than IM vaccination, in particular the CD8 T cells. Moreover, blocking lymphocyte circulation abrogated IM but not IN immunization induced protection, illustrating the critical role of local memory immune response upon viral infection. Notably, the CD40-targeted nasal delivery not only improved the magnitude but also the breadth of protection, including against lethal challenge with a newly isolated highly pathogenic avian H5N1 strain. These findings are informative for the design of universal mucosal vaccines, where the predominant mode of protection is independent of neutralizing antibodies.
-
FC/FACS
-
Mus musculus (House mouse)
-
Immunology and Microbiology
In Immunity on 9 July 2024 by Yeh, A. C., Koyama, M., et al.
Allogeneic T cell expansion is the primary determinant of graft-versus-host disease (GVHD), and current dogma dictates that this is driven by histocompatibility antigen disparities between donor and recipient. This paradigm represents a closed genetic system within which donor T cells interact with peptide-major histocompatibility complexes (MHCs), though clonal interrogation remains challenging due to the sparseness of the T cell repertoire. We developed a Bayesian model using donor and recipient T cell receptor (TCR) frequencies in murine stem cell transplant systems to define limited common expansion of T cell clones across genetically identical donor-recipient pairs. A subset of donor CD4+ T cell clonotypes differentially expanded in identical recipients and were microbiota dependent. Microbiota-specific T cells augmented GVHD lethality and could target microbial antigens presented by gastrointestinal epithelium during an alloreactive response. The microbiota serves as a source of cognate antigens that contribute to clonotypic T cell expansion and the induction of GVHD independent of donor-recipient genetics.
Copyright © 2024 Elsevier Inc. All rights reserved.
-
Mus musculus (House mouse)
-
Immunology and Microbiology
-
Stem Cells and Developmental Biology
In Cell Host & Microbe on 13 March 2024 by Ngo, V. L., Lieber, C. M., et al.
Susceptibility to respiratory virus infections (RVIs) varies widely across individuals. Because the gut microbiome impacts immune function, we investigated the influence of intestinal microbiota composition on RVI and determined that segmented filamentous bacteria (SFB), naturally acquired or exogenously administered, protected mice against influenza virus (IAV) infection. Such protection, which also applied to respiratory syncytial virus and severe acute respiratory syndrome coronavirus 2 (SARS-CoV-2), was independent of interferon and adaptive immunity but required basally resident alveolar macrophages (AMs). In SFB-negative mice, AMs were quickly depleted as RVI progressed. In contrast, AMs from SFB-colonized mice were intrinsically altered to resist IAV-induced depletion and inflammatory signaling. Yet, AMs from SFB-colonized mice were not quiescent. Rather, they directly disabled IAV via enhanced complement production and phagocytosis. Accordingly, transfer of SFB-transformed AMs into SFB-free hosts recapitulated SFB-mediated protection against IAV. These findings uncover complex interactions that mechanistically link the intestinal microbiota with AM functionality and RVI severity.
Copyright © 2024 Elsevier Inc. All rights reserved.
-
Mus musculus (House mouse)
-
Immunology and Microbiology
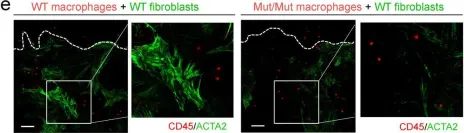
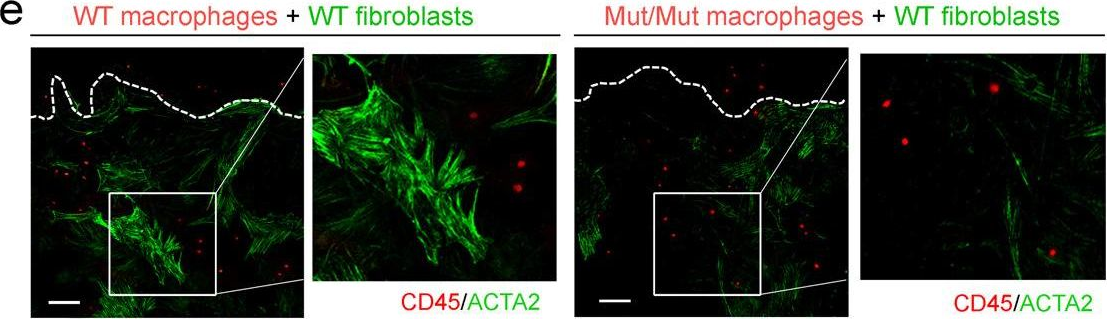
In Nat Commun on 30 November 2022 by Chen, H., Chew, G., et al.
Fig.3.E
-
IHC-IF
-
Mus musculus (House mouse)
Collected and cropped from Nature Communications by CiteAb, provided under a CC-BY license
Image 1 of 1