In the thymus, T cell progenitors differentiate in order to generate naive T lymphocytes which migrate in the periphery where they will fulfill their function in the adaptive immune response. During thymopoiesis, genomic alterations in thymocytes can promote leukemia development. Among recurrent alteration is PTEN inactivation, which is associated to MYC overexpression. Herein, we used conditional Pten and Myc knockout mouse models and single-cell RNA-sequencing approach, to investigate the impact of MYC loss on physio-pathological development of PTEN-proficient or PTEN-deficient T lymphocytes. First, our results confirm that MYC is mandatory for PTEN loss-mediated leukemogenesis, while it is not required for terminal steps of thymopoiesis. In contrast, we uncovered that Myc ablation in CD4+CD8+ thymocytes disrupts T lymphocytes homeostasis in the spleen, notably by drastically reducing the number of MYC-deficient effector/memory T cells. Collectively, our data show that besides naive T cells proliferation, MYC is essential for effector/memory differentiation.
© 2021 The Authors.
Product Citations: 3
MYC deficiency impairs the development of effector/memory T lymphocytes.
In IScience on 23 July 2021 by Nozais, M., Loosveld, M., et al.
-
Mus musculus (House mouse)
In Communications Biology on 1 February 2019 by Xiao, C., Wu, M., et al.
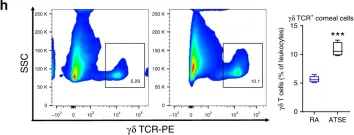
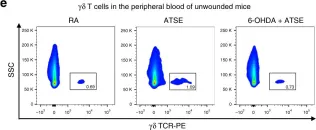
Exposure to tobacco smoke is a major public health concern that can also affect ophthalmic health. Based on previous work demonstrating the important role of the sympathetic nervous system (SNS) in corneal wound repair, we postulated that acute tobacco smoke exposure (ATSE) may act through the SNS in the impairment of corneal wound repair. Here we find that ATSE rapidly increases the markers of inflammatory response in normal corneal limbi. After an abrasion injury, ATSE exaggerates inflammation, impairs wound repair, and enhances the expression of nuclear factor-κB (NF-κB) and inflammatory molecules such as interleukin-6 (IL-6) and IL-17. We find that chemical SNS sympathectomy, local adrenergic receptor antagonism, NF-κB1 inactivation, and IL-6/IL-17A neutralization can all independently attenuate ATSE-induced excessive inflammatory responses and alleviate their impairment of the healing process. These findings highlight that the SNS may represent a major molecular sensor and mediator of ATSE-induced inflammation.
-
FC/FACS
-
Mus musculus (House mouse)
-
Immunology and Microbiology
In Leukemia on 1 November 2009 by Lee, H. M., Wu, W., et al.
We reported that complement cascade (CC) becomes activated in bone marrow (BM) during granulocyte colony-stimulating factor (G-CSF) mobilization of hematopoietic stem/progenitor cells (HSPCs) and showed that, although third CC component (C3)-deficient mice are easy mobilizers, fifth CC component (C5)-deficient mice mobilize very poorly. To explain this, we postulated that activation/cleavage of CC releases C3a and C5a anaphylatoxins that differently regulate mobilization. Accordingly, C3a, by enhancing responsiveness of HSPCs to decreasing concentrations of stromal-derived growth factor-1 (SDF-1) in BM, prevents mobilization and promotes their BM retention. Therefore, in this study, we focused on the mobilization-enhancing role of C5a. We found that C5a receptor (C5aR) is not expressed on the surface of HSPCs, and that C5a-mediated promobilization effects are mediated by stimulation of granulocytes. Overall, our data support the following model. First C5aR(+) granulocytes are chemoattracted by plasma C5 cleavage fragments, being the first wave of cells leaving BM. This facilitates a subsequent egress of HSPCs. In the next step, after leaving BM, granulocytes undergo degranulation in response to plasma C5a and secrete some cationic peptides (cathelicidin, beta-defensin) that, as shown here for the first time, highly enhance the responsiveness of HSPCs to plasma SDF-1 gradient. In conclusion, our data reveal the underappreciated central role of innate immunity in mobilization, in which C5 cleavage fragments through granulocytes orchestrate this process.
-
Cancer Research
-
Immunology and Microbiology
In Commun Biol on 1 February 2019 by Xiao, C., Wu, M., et al.
Fig.1.H

-
FC/FACS
-
Mus musculus (House mouse)
Collected and cropped from Commun Biol by CiteAb, provided under a CC-BY license
Image 1 of 2
In Commun Biol on 1 February 2019 by Xiao, C., Wu, M., et al.
Fig.2.E

-
FC/FACS
-
Mus musculus (House mouse)
Collected and cropped from Commun Biol by CiteAb, provided under a CC-BY license
Image 1 of 2