Immunoglobulin A (IgA) maintains commensal communities in the intestine while preventing dysbiosis. IgA generated against intestinal microbes assures the simultaneous binding to multiple, diverse commensal-derived antigens. However, the exact mechanisms by which B cells mount broadly reactive IgA to the gut microbiome remains elusive. Here, we have shown that IgA B cell receptor (BCR) is required for B cell fitness during the germinal center (GC) reaction in Peyer's patches (PPs) and for generation of gut-homing plasma cells (PCs). We demonstrate that IgA BCR drove heightened intracellular signaling in mouse and human B cells, and as a consequence, IgA+ B cells received stronger positive selection cues. Mechanistically, IgA BCR signaling offset Fas-mediated death, possibly rescuing low-affinity B cells to promote a broad humoral response to commensals. Our findings reveal an additional mechanism linking BCR signaling, B cell fate, and antibody production location, which have implications for how intestinal antigen recognition shapes humoral immunity.
Copyright © 2023 Elsevier Inc. All rights reserved.
Product Citations: 4
Antigen receptor signaling and cell death resistance controls intestinal humoral response zonation.
In Immunity on 10 October 2023 by Raso, F., Liu, S., et al.
-
Immunology and Microbiology
In Haematologica on 1 September 2019 by D'Agaro, T., Zucchetto, A., et al.
Toll-like receptor 9 antagonizes antibody affinity maturation.
In Nature Immunology on 1 March 2018 by Akkaya, M., Akkaya, B., et al.
Key events in T cell-dependent antibody responses, including affinity maturation, are dependent on the B cell's presentation of antigen to helper T cells at critical checkpoints in germinal-center formation in secondary lymphoid organs. Here we found that signaling via Toll-like receptor 9 (TLR9) blocked the ability of antigen-specific B cells to capture, process and present antigen and to activate antigen-specific helper T cells in vitro. In a mouse model in vivo and in a human clinical trial, the TLR9 agonist CpG enhanced the magnitude of the antibody response to a protein vaccine but failed to promote affinity maturation. Thus, TLR9 signaling might enhance antibody titers at the expense of the ability of B cells to engage in germinal-center events that are highly dependent on B cells' capture and presentation of antigen.
-
Immunology and Microbiology
In The Journal of Experimental Medicine on 5 February 2018 by Tissino, E., Benedetti, D., et al.
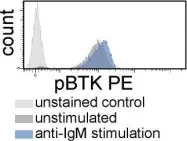
The Bruton's tyrosine kinase (BTK) inhibitor ibrutinib, which antagonizes B cell receptor (BCR) signals, demonstrates remarkable clinical activity in chronic lymphocytic leukemia (CLL). The lymphocytosis experienced by most patients under ibrutinib has previously been attributed to inhibition of BTK-dependent integrin and chemokine cues operating to retain the tumor cells in nodal compartments. Here, we show that the VLA-4 integrin, as expressed by CD49d-positive CLL, can be inside-out activated upon BCR triggering, thus reinforcing the adhesive capacities of CLL cells. In vitro and in vivo ibrutinib treatment, although reducing the constitutive VLA-4 activation and cell adhesion, can be overcome by exogenous BCR triggering in a BTK-independent manner involving PI3K. Clinically, in three independent ibrutinib-treated CLL cohorts, CD49d expression identifies cases with reduced lymphocytosis and inferior nodal response and behaves as independent predictor of shorter progression-free survival, suggesting the retention of CD49d-expressing CLL cells in tissue sites via activated VLA-4. Evaluation of CD49d expression should be incorporated in the characterization of CLL undergoing therapy with BCR inhibitors.
© 2018 Tissino et al.
-
FC/FACS
-
Homo sapiens (Human)
-
Cancer Research
In J Exp Med on 5 February 2018 by Tissino, E., Benedetti, D., et al.
Fig.1.B

-
FC/FACS
-
Homo sapiens (Human)
Collected and cropped from J Exp Med by CiteAb, provided under a CC-BY license
Image 1 of 1