Memory B cells (MBCs) are key providers of long-lived immunity against infectious disease, yet in chronic viral infection, they do not produce effective protection. How chronic viral infection disrupts MBC development and whether such changes are reversible remain unknown. Through single-cell (sc)ATAC-seq and scRNA-seq during acute versus chronic lymphocytic choriomeningitis viral infection, we identified a memory subset enriched for interferon (IFN)-stimulated genes (ISGs) during chronic infection that was distinct from the T-bet+ subset normally associated with chronic infection. Blockade of IFNAR-1 early in infection transformed the chromatin landscape of chronic MBCs, decreasing accessibility at ISG-inducing transcription factor binding motifs and inducing phenotypic changes in the dominating MBC subset, with a decrease in the ISG subset and an increase in CD11c+CD80+ cells. However, timing was critical, with MBCs resistant to intervention at 4 weeks post-infection. Together, our research identifies a key mechanism to instruct MBC identity during viral infection.
Copyright © 2024 Elsevier Inc. All rights reserved.
Product Citations: 13
In Immunity on 14 May 2024 by Cooper, L., Xu, H., et al.
-
Immunology and Microbiology
TRAPnSeq allows high-throughput profiling of antigen-specific antibody-secreting cells.
In Cell Rep Methods on 24 July 2023 by Asrat, S., Devlin, J. C., et al.
Following activation by cognate antigen, B cells undergo fine-tuning of their antigen receptors and may ultimately differentiate into antibody-secreting cells (ASCs). While antigen-specific B cells that express surface receptors (B cell receptors [BCRs]) can be readily cloned and sequenced following flow sorting, antigen-specific ASCs that lack surface BCRs cannot be easily profiled. Here, we report an approach, TRAPnSeq (antigen specificity mapping through immunoglobulin [Ig] secretion TRAP and Sequencing), that allows capture of secreted antibodies on the surface of ASCs, which in turn enables high-throughput screening of single ASCs against large antigen panels. This approach incorporates flow cytometry, standard microfluidic platforms, and DNA-barcoding technologies to characterize antigen-specific ASCs through single-cell V(D)J, RNA, and antigen barcode sequencing. We show the utility of TRAPnSeq by profiling antigen-specific IgG and IgE ASCs from both mice and humans and highlight its capacity to accelerate therapeutic antibody discovery from ASCs.
© 2023 The Authors.
-
Immunology and Microbiology
Single cell clonal analysis identifies an AID-dependent pathway of plasma cell differentiation.
In EMBO Reports on 6 December 2022 by Gómez-Escolar, C., Serrano-Navarro, A., et al.
Germinal centers (GC) are microstructures where B cells that have been activated by antigen can improve the affinity of their B cell receptors and differentiate into memory B cells (MBCs) or antibody-secreting plasma cells. Here, we have addressed the role of activation-induced deaminase (AID), which initiates somatic hypermutation and class switch recombination, in the terminal differentiation of GC B cells. By combining single cell transcriptome and immunoglobulin clonal analysis in a mouse model that traces AID-experienced cells, we have identified a novel subset of late-prePB cells (L-prePB), which shares the strongest clonal relationships with plasmablasts (PBs). Mice lacking AID have various alterations in the size and expression profiles of transcriptional clusters. We find that AID deficiency leads to a reduced proportion of L-prePB cells and severely impairs transitions between the L-prePB and the PB subsets. Thus, AID shapes the differentiation fate of GC B cells by enabling PB generation from a prePB state.
© 2022 The Authors. Published under the terms of the CC BY NC ND 4.0 license.
-
FC/FACS
-
Mus musculus (House mouse)
In Cell Reports on 15 March 2022 by Mu, Z., Wiehe, K., et al.
The success of nucleoside-modified mRNAs in lipid nanoparticles (mRNA-LNP) as COVID-19 vaccines heralded a new era of vaccine development. For HIV-1, multivalent envelope (Env) trimer protein nanoparticles are superior immunogens compared with trimers alone for priming of broadly neutralizing antibody (bnAb) B cell lineages. The successful expression of complex multivalent nanoparticle immunogens with mRNAs has not been demonstrated. Here, we show that mRNAs can encode antigenic Env trimers on ferritin nanoparticles that initiate bnAb precursor B cell expansion and induce serum autologous tier 2 neutralizing activity in bnAb precursor VH + VL knock-in mice. Next-generation sequencing demonstrates acquisition of critical mutations, and monoclonal antibodies that neutralize heterologous HIV-1 isolates are isolated. Thus, mRNA-LNP can encode complex immunogens and may be of use in design of germline-targeting and sequential boosting immunogens for HIV-1 vaccine development.
Copyright © 2022 The Authors. Published by Elsevier Inc. All rights reserved.
-
Genetics
In Immunity on 12 October 2021 by Duan, L., Liu, D., et al.
B cells within germinal centers (GCs) enter cycles of antibody affinity maturation or exit the GC as memory cells or plasma cells. Here, we examined the contribution of interleukin (IL)-4 on B cell fate decisions in the GC. Single-cell RNA-sequencing identified a subset of light zone GC B cells expressing high IL-4 receptor-a (IL4Ra) and CD23 and lacking a Myc-associated signature. These cells could differentiate into pre-memory cells. B cell-specific deletion of IL4Ra or STAT6 favored the pre-memory cell trajectory, and provision of exogenous IL-4 in a wild-type context reduced pre-memory cell frequencies. IL-4 acted during antigen-specific interactions but also influenced bystander cells. Deletion of IL4Ra from follicular dendritic cells (FDCs) increased the availability of IL-4 in the GC, impaired the selection of affinity-matured B cells, and reduced memory cell generation. We propose that GC FDCs establish a niche that limits bystander IL-4 activity, focusing IL-4 action on B cells undergoing selection and enhancing memory cell differentiation.
Copyright © 2021 Elsevier Inc. All rights reserved.
-
Mus musculus (House mouse)
-
Immunology and Microbiology
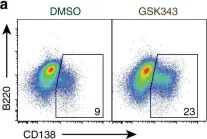
In Nat Commun on 27 April 2018 by Scharer, C. D., Barwick, B. G., et al.
Fig.7.A

-
FC/FACS
-
Collected and cropped from Nat Commun by CiteAb, provided under a CC-BY license
Image 1 of 2
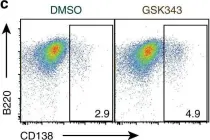
In Nat Commun on 27 April 2018 by Scharer, C. D., Barwick, B. G., et al.
Fig.7.C

-
FC/FACS
-
Collected and cropped from Nat Commun by CiteAb, provided under a CC-BY license
Image 1 of 2