Regulation of the nuclear factor-kappa B (NF-kB) signaling pathway is a major host homeostatic mechanism for controlling hyper-inflammation or chronic inflammation. Despite extensive research, the regulatory factors of NF-kB signaling required to preserve homeostasis and control inflammatory disorders are not fully understood. Moreover, the role of MARCH2 in chronic inflammation models and the regulation of MARCH2 activation remain to be elucidated.
We monitored disease severity and mortality in MARCH2-/- or MARCH2+/+ mice induced experimental colitis. Susceptibility to DSS-induced experimental colitis was determined by various methods, including Swiss roll assay and fluorescein isothiocyanate (FITC)-dextran treatment, respectively. RNA-sequencing was conducted to recognize the inflammatory response-related genes in the distal colon of colitis-induced mice. Enzyme-linked immunosorbent assay (ELISA) was used to measure the cytokines and chemokines with in vitro and in vivo samples. Affinity purification and LC-MS/MS analysis were used to identify the MARCH2 interacting proteins and posttranslational modifications. The underlying mechanism was elucidated using immunoblotting, co-immunoprecipitation, ubiquitination assay, and confocal microscopy.
Here, we report that MARCH2-/- mice were more susceptible to experimental inflammatory bowel disease (IBD) due to the massive production of cytokines. Stimulation by inflammatory cytokines such as TNF induces dimerization of MARCH2 at a later stage and dimerized MARCH2 undergoes K63-linked autoubiquitination at lysine 127 and 238, which promotes NEMO recognition, ubiquitination and proteasomal degradation. We also show an interaction between MARCH2 and MARCH8 in resting cells that inhibits MARCH2 activation. Taken together, these findings provide new insights into the molecular mechanism of MARCH2 and suggest a crucial role of MARCH2 in the modulation of inflammation and cellular homeostasis.
Our results indicate that MARCH2 plays a critical role in regulating NEMO/IKKγ under the inflammatory and resting conditions, thereby suppressing excessive or unexpected inflammatory responses. Our findings here not only demonstrate a biological role of MARCH2 in inflammatory signaling pathways but also provide a novel insight in the underlying mechanism.
© 2025. The Author(s).
Product Citations: 1,022
The E3 ubiquitin ligase MARCH2 controls TNF-α mediated inflammation by autoubiquitination.
In Cell Communication and Signaling : CCS on 31 May 2025 by Chathuranga, K., Rathnapala, P., et al.
-
Endocrinology and Physiology
-
Immunology and Microbiology
In Molecular Omics on 12 May 2025 by Pascual-Vargas, P., Arias-Garcia, M., et al.
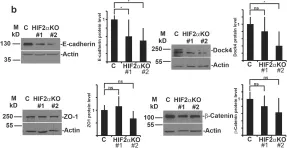
YAP and TAZ are transcriptional co-activators that are inhibited by sequestration in the cytoplasm. Cellular signalling pathways integrate soluble, mechanical (cytoskeleton, adhesion), and geometric (cell size, morphology) cues to regulate the translocation of YAP/TAZ to the nucleus. In triple-negative breast cancer (TNBC) cells, both signalling and morphogenesis are frequently rewired, leading to increased YAP/TAZ translocation, which drives proliferation, invasion, and drug resistance. However, whether this increased YAP/TAZ translocation is due to alterations in upstream signalling events or changes in cell morphology remains unclear. To gain insight into YAP/TAZ regulation in TNBC cells, we performed multiplexed quantitative genetic screens for YAP/TAZ localisation and cell shape, enabling us to determine whether changes in YAP/TAZ localisation following gene knockdown could be explained by alterations in cell morphology. These screens revealed that the focal adhesion (FA)-associated RhoGEF DOCK5 is essential for YAP/TAZ nuclear localisation in TNBC cells. DOCK5-defective cells exhibit defects in FA morphogenesis and fail to generate a stable, polarised leading edge, which we propose contributes to impaired YAP/TAZ translocation. Mechanistically, we implicate DOCK5's ability to act as a RacGEF and as a scaffold for NCK/AKT as key to its role in FA morphogenesis. Importantly, DOCK5 is essential for promoting the resistance of LM2 cells to the clinically used MEK inhibitor Binimetinib. Taken together, our findings suggest that DOCK5's role in TNBC cell shape determination drives YAP/TAZ upregulation and drug resistance.
In Oncogene on 6 April 2025 by Wouters, V. M., Helderman, R. F. C. P. A., et al.
Colorectal cancer (CRC) can be divided into 4 subtypes of which consensus molecular subtype 4 (CMS4) is associated with metastasis and poor survival. Previously, we reported that the KPN mouse model resembles human CMS4. Strikingly, although tumor formation in this model is slow and limited, effective metastasis is observed. To understand this aggressive behavior, we compared two distinct in vitro KPN models, organoids and tumoroids. The organoid model only carries the original mutations, while the tumoroids are derived from in vivo grown tumors that underwent selection during development. Here, we reveal that tumoroids harbor endogenous WNT pathway activity, which can be driven by tankyrase activity and Cdx2 downregulation. Importantly, WNT pathway activation was heterogeneous in nature, subject to regulation and allowed for a mixture of WNT-driven and YAP-driven cells within tumoroids. This unique type of WNT pathway activation is not crucial for colonic tumor growth, but results in metastatic spreading. Intriguingly, these findings reflect a specific subset of aggressive human CMS4 cancers that display low CDX2 expression and lack of classical WNT pathway mutations, while having a higher tendency to metastasize. Together, these data propose a novel mechanism for WNT pathway activation that drives metastasis formation in aggressive CRC.
© 2025. The Author(s).
-
Cancer Research
Clonal memory of colitis accumulates and promotes tumor growth
Preprint on Research Square on 27 March 2025 by Buenrostro, J., Nagaraja, S., et al.
Abstract Chronic inflammation is a well-established risk factor for cancer, but the underlying molecular mechanisms remain unclear. Using a mouse model of colitis, we demonstrate that colonic stem cells retain an epigenetic memory of inflammation following disease resolution, characterized by a cumulative gain of activator protein 1 (AP-1) transcription factor activity. Further, we develop SHARE-TRACE, a method that enables simultaneous profiling of gene expression, chromatin accessibility and clonal history in single cells, enabling high resolution tracking of epigenomic memory. This reveals that inflammatory memory is propagated cell-intrinsically and inherited through stem cell lineages, with certain clones demonstrating dramatically stronger memory than others. Finally, we show that colitis primes stem cells for amplified expression of regenerative gene programs following oncogenic mutation that accelerate tumor growth. This includes a subpopulation of tumors that have exceptionally high AP-1 activity and the additional upregulation of pro-oncogenic programs. Together, our findings provide a mechanistic link between chronic inflammation and malignancy, revealing how long-lived epigenetic alterations in regenerative tissues may contribute to disease susceptibility and suggesting potential therapeutic strategies to mitigate cancer risk in patients with chronic inflammatory conditions.
-
Cancer Research
Preprint on BioRxiv : the Preprint Server for Biology on 18 March 2025 by Badyaev, A. V., Moreno, C. S., et al.
ABSTRACT Development and evolution require both stability and adaptability, yet how these opposite properties are reconciled is unclear. Here, we show that intrinsically disordered proteins (IDPs) act as reset mechanisms in conserved regulatory networks facilitating developmental transitions by integrating physical processes with genetic regulation. By tracing the ontogeny of mesenchymal cells in avian beak primordia, we demonstrate that mechanosensitive IDPs mediate shifts between physical cell states via dosage-dependent binding plasticity, converting stochastic protein variation into discreet regulatory networks. The disorder-enabled connectivity in these proteins resets their regulatory specialization and promotes population divergence. Comparative analyses across avian proteomes confirm that binding plasticity in transcriptional IDPs drives their diverse regulatory associations and accelerates their evolution. By resetting specialized states in conserved regulatory networks, IDPs flexibly regulate developmental pathways and reconcile precision with evolvability.
-
Stem Cells and Developmental Biology
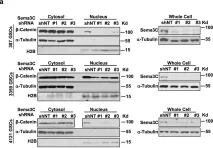
In Nat Commun on 4 September 2024 by Serafin, D. S., Harris, N. R., et al.
Fig.1.C

-
WB
-
Collected and cropped from Nat Commun by CiteAb, provided under a CC-BY license
Image 1 of 174
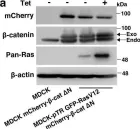
In Sci Rep on 27 May 2024 by Raykhel, I., Ronkainen, V. P., et al.
Fig.2.B

-
WB
-
Canis lupus familiaris (Domestic dog)
Collected and cropped from Sci Rep by CiteAb, provided under a CC-BY license
Image 1 of 174
In Nat Commun on 23 May 2024 by El Bakkouri, Y., Chidiac, R., et al.
Fig.3.A

-
IHC-IF
-
Collected and cropped from Nat Commun by CiteAb, provided under a CC-BY license
Image 1 of 174
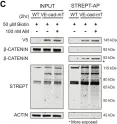
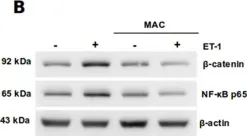
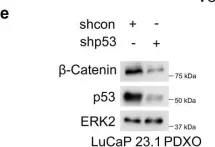
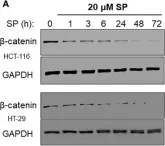
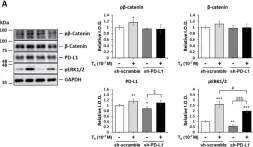
In Cancer Cell Int on 10 December 2023 by Rodas, F., Vidal-Vidal, J. A., et al.
Fig.5.D

-
WB
-
Homo sapiens (Human)
Collected and cropped from Cancer Cell Int by CiteAb, provided under a CC-BY license
Image 1 of 174
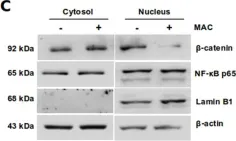
In Cancer Cell Int on 10 December 2023 by Rodas, F., Vidal-Vidal, J. A., et al.
Fig.2.B

-
WB
-
Homo sapiens (Human)
Collected and cropped from Cancer Cell Int by CiteAb, provided under a CC-BY license
Image 1 of 174
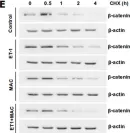
In Cancer Cell Int on 10 December 2023 by Rodas, F., Vidal-Vidal, J. A., et al.
Fig.2.C

-
WB
-
Homo sapiens (Human)
Collected and cropped from Cancer Cell Int by CiteAb, provided under a CC-BY license
Image 1 of 174
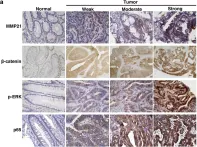
In Cancer Cell Int on 10 December 2023 by Rodas, F., Vidal-Vidal, J. A., et al.
Fig.2.E

-
WB
-
Homo sapiens (Human)
Collected and cropped from Cancer Cell Int by CiteAb, provided under a CC-BY license
Image 1 of 174
In Nat Commun on 3 November 2023 by Nakai, K., Lin, H., et al.
Fig.6.A

-
IHC
-
Collected and cropped from Nat Commun by CiteAb, provided under a CC-BY license
Image 1 of 174
In Nat Commun on 3 November 2023 by Nakai, K., Lin, H., et al.
Fig.3.A

-
WB
-
Collected and cropped from Nat Commun by CiteAb, provided under a CC-BY license
Image 1 of 174
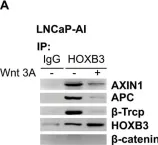
In Nat Commun on 3 August 2023 by Ding, D., Blee, A. M., et al.
Fig.7.E

-
WB
-
Collected and cropped from Nat Commun by CiteAb, provided under a CC-BY license
Image 1 of 174
In Antioxidants (Basel) on 2 August 2023 by Fosso, E., Leo, M., et al.
Fig.2.D

-
WB
-
Collected and cropped from Antioxidants (Basel) by CiteAb, provided under a CC-BY license
Image 1 of 174
In Nat Commun on 20 April 2023 by Hao, J., Han, X., et al.
Fig.4.A

-
WB
-
Collected and cropped from Nat Commun by CiteAb, provided under a CC-BY license
Image 1 of 174
In Biomedicines on 7 April 2023 by Li, C., Wu, Y., et al.
Fig.2.D

-
WB
-
Collected and cropped from Biomedicines by CiteAb, provided under a CC-BY license
Image 1 of 174
In Biomedicines on 7 April 2023 by Li, C., Wu, Y., et al.
Fig.2.B

-
WB
-
Collected and cropped from Biomedicines by CiteAb, provided under a CC-BY license
Image 1 of 174
In Biomedicines on 7 April 2023 by Li, C., Wu, Y., et al.
Fig.1.E

-
ICC-IF
-
Collected and cropped from Biomedicines by CiteAb, provided under a CC-BY license
Image 1 of 174
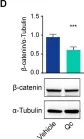
In Biomedicines on 7 April 2023 by Li, C., Wu, Y., et al.
Fig.1.D

-
WB
-
Collected and cropped from Biomedicines by CiteAb, provided under a CC-BY license
Image 1 of 174
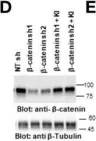
In Front Oncol on 1 April 2023 by Alam, A., Smith, S. C., et al.
Fig.2.A

-
WB
-
Collected and cropped from Front Oncol by CiteAb, provided under a CC-BY license
Image 1 of 174
In Cell Death Dis on 27 March 2023 by Zhu, S., Yang, Z., et al.
Fig.5.A

-
WB
-
Collected and cropped from Cell Death Dis by CiteAb, provided under a CC-BY license
Image 1 of 174
In Sci Rep on 28 December 2022 by Mieremet, A., van der Stoel, M., et al.
Fig.3.A

-
ICC-IF
-
Collected and cropped from Sci Rep by CiteAb, provided under a CC-BY license
Image 1 of 174
In Front Oncol on 5 November 2022 by Ghatak, S., Hascall, V. C., et al.
Fig.5.D

-
WB
-
Collected and cropped from Front Oncol by CiteAb, provided under a CC-BY license
Image 1 of 174
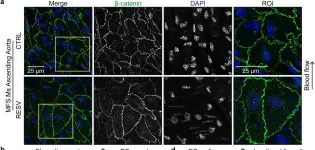
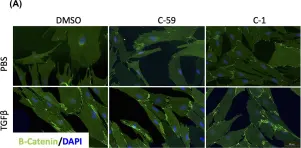
In Clin Sci (Lond) on 14 October 2022 by Lewis, A., Sanchez, S., et al.
Fig.4.A

-
ICC-IF
-
Collected and cropped from Clin Sci (Lond) by CiteAb, provided under a CC-BY license
Image 1 of 174
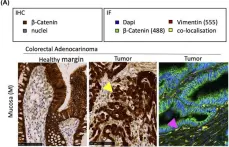
In Clin Sci (Lond) on 14 October 2022 by Lewis, A., Sanchez, S., et al.
Fig.1.A

-
IHC-IF
-
Collected and cropped from Clin Sci (Lond) by CiteAb, provided under a CC-BY license
Image 1 of 174
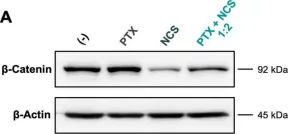
In Int J Mol Sci on 4 October 2022 by Cámara-Sánchez, P., Díaz-Riascos, Z. V., et al.
Fig.8.A

-
WB
-
Collected and cropped from Int J Mol Sci by CiteAb, provided under a CC-BY license
Image 1 of 174
In Cells on 29 September 2022 by Su, K. W., Lin, H. Y., et al.
Fig.7.A

-
WB
-
Collected and cropped from Cells by CiteAb, provided under a CC-BY license
Image 1 of 174
In Sci Rep on 1 September 2022 by Ruiz-Mitjana, A., Navaridas, R., et al.
Fig.3.D

-
WB
-
Mus musculus (House mouse)
Collected and cropped from Sci Rep by CiteAb, provided under a CC-BY license
Image 1 of 174