
κB-Ras/RalGAP complexes limit the activity of Ral GTPases, which function in EGFR/Ras signaling. RalGAP expression is down-regulated in pancreatic cancer; however, the role of RalGAP and Ral GTPases in tumor development in vivo remained unclear. Here, we show that pancreatic RalGAPβ deficiency alone is sufficient to induce inflammation and neoplasia in vivo. We identify that this phenotype is triggered by disturbance of the secretory pathway and polarized exocytosis in acinar cells, demonstrating that RalGAP complexes uphold spatial control of Ral activity. We furthermore show that RALGAPβ deficiency results in defective primary cilium assembly, a process required for efficient acinar regeneration upon inflammation. Only primary cilium formation depends on κB-Ras proteins, suggesting that κB-Ras proteins are not essential for all RalGAP complex-controlled processes. In combination with an oncogenic KRAS G12D mutation, RalGAPβ deficiency leads to a dramatic shortening of tumor latency and median survival. Our results highlight an important role of RalGAP/Ral signaling in upholding acinar cell identity and preventing pancreatic cancer development.
© 2025 Apken et al.
Product Citations: 1,896
RalGAP complexes control secretion and primary cilia in pancreatic disease.
In Life Science Alliance on 1 August 2025 by Apken, L. H., Barz, H., et al.
-
IHC-P-IF
-
Mus musculus (House mouse)
Identification of functional non-coding variants associated with orofacial cleft.
In Nature Communications on 16 July 2025 by Kumari, P., Friedman, R. Z., et al.
Oral facial cleft (OFC) comprises cleft lip with or without cleft palate (CL/P) or cleft palate only. Genome wide association studies (GWAS) of isolated OFC have identified common single nucleotide polymorphisms (SNPs) in many genomic loci where the presumed effector gene (for example, IRF6 in the 1q32 locus) is expressed in embryonic oral epithelium. To identify candidates for functional SNPs at eight such loci we conduct a massively parallel reporter assay in a fetal oral epithelial cell line, revealing SNPs with allele-specific effects on enhancer activity. We filter these SNPs against chromatin-mark evidence of enhancers and test a subset in traditional reporter assays, which support the candidacy of SNPs at loci containing FOXE1, IRF6, MAFB, TFAP2A, and TP63. For two SNPs near IRF6 and one near FOXE1, we engineer the genome of induced pluripotent stem cells, differentiate the cells into embryonic oral epithelium, and discover allele-specific effects on the levels of effector gene expression, and, in two cases, the binding affinity of transcription factors FOXE1 or ETS2. Conditional analyses of GWAS data suggest the two functional SNPs near IRF6 account for the majority of risk for CL/P at this locus. This study connects genetic variation associated with OFC to mechanisms of pathogenesis.
© 2025. The Author(s).
Old mitochondria regulate niche renewal via α-ketoglutarate metabolism in stem cells.
In Nature Metabolism on 14 July 2025 by Andersson, S., Bui, H., et al.
Cellular metabolism is a key regulator of cell fate1, raising the possibility that the recently discovered metabolic heterogeneity between newly synthesized and chronologically old organelles may affect stem cell fate in tissues2,3. In the small intestine, intestinal stem cells (ISCs)4 produce metabolically distinct progeny5, including their Paneth cell (PC) niche6. Here we show that asymmetric cell division of mouse ISCs generates a subset enriched for old mitochondria (ISCmito-O), which are metabolically distinct, and form organoids independently of niche because of their ability to recreate the PC niche. ISCmito-O mitochondria produce more α-ketoglutarate, driving ten-eleven translocation-mediated epigenetic changes that promote PC formation. In vivo α-ketoglutarate supplementation enhanced PC turnover and niche renewal, aiding recovery from chemotherapy-induced damage in aged mice. Our results reveal a subpopulation of ISCs whose old mitochondria metabolically regulate cell fate, and provide proof of principle for metabolically promoted replacement of specific aged cell types in vivo.
© 2025. The Author(s).
-
Biochemistry and Molecular biology
-
Cell Biology
-
Stem Cells and Developmental Biology
In Histochemistry and Cell Biology on 14 July 2025 by Martínez-Rodríguez, D., Salazar-Alonso, J., et al.
Diabetes mellitus (DM) is characterized by the loss or dysfunction pancreatic β-cells. Human amniotic epithelial cells (hAEC), which retain pluripotency markers and are readily obtainable from term placentas, represent a promising alternative source of stem cells. We investigated whether hAECs can be guided through pancreatic ontogeny to generate insulin-producing β-like cells. hAEC from uncomplicated term deliveries were expanded to passage 1 and exposed to a four-stage differentiation sequence that sequentially modulated Activin/WNT, KGF/TGF-β, retinoic-acid/hedgehog, and EGF/Noggin signaling. Stage progression was monitored by end-point RT-PCR and quantitative immunofluorescence for hallmark transcription factors. After definitive endoderm induction, 64% of cells were Brachyury positive and 71% were WNT3A positive; primitive-gut specification yielded 57% HNF1B+ cells. Posterior foregut commitment produced 75% PDX1+ and 60% Sox9+ nuclei and the final endocrine stage generated 74% NKX2.2+ cells, with 71% showing cytoplasmatic insulin and 51% C-peptide staining; insulin/C-peptide co-localization was confirmed by double labelling. Thus a chemically defined, four-step protocol can convert term-derived hAEC into insulin-producing β-like cells, supporting their use as an accessible platform for diabetes modelling and future cell-replacement therapies.
© 2025. The Author(s).
-
Cell Biology
-
Endocrinology and Physiology
In Scientific Reports on 1 July 2025 by Kofuji, S., Qian, Y., et al.
The stress-responsive kinase MKK7 controls various brain functions. Previously, we showed that neural stem cell-specific deletion of the Mkk7 gene caused abnormal brain development and death immediately after birth (perinatal lethality). However, the region-specific roles of MKK7 during embryonic brain development remain unclear. In this study, we generated three strains of conditional Mkk7 knockout (Mkk7 cKO) mice with deletion of Mkk7 specifically in either the spinal cord, or midbrain/cerebellum, or cerebrum. Loss of MKK7 in the the spinal cord had no effect on mouse embryonic viability, but mice lacking MKK7 in the midbrain/cerebellum displayed perinatal lethality. In contrast, mice with loss of MKK7 in the cerebrum were born at the expected Mendelian ratio but died within five weeks of birth. The brains of these latter mutants showed a thinner cerebral cortex, enlarged ventricles, and decreased phosphorylation of microtubule-associated protein 1B (MAP1B) compared to wild type (WT) brains. This work expands our knowledge of MKK7 functions in the brain and shows that this kinase regulates brain development and maturation in a region-specific manner.
© 2025. The Author(s).
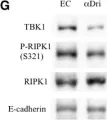
In Front Cell Dev Biol on 26 June 2025 by Rodriguez-Baili, M. C., Palma-Cobo, M., et al.
Fig.5.B

-
WB
-
Collected and cropped from Front Cell Dev Biol by CiteAb, provided under a CC-BY license
Image 1 of 404
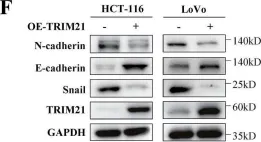
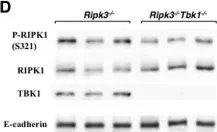
In Cell Death Dis on 31 January 2025 by Cao, M., Shao, Z., et al.
Fig.3.F

-
WB
-
Collected and cropped from Cell Death Dis by CiteAb, provided under a CC-BY license
Image 1 of 404
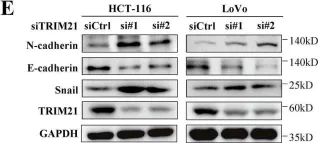
In Cell Death Dis on 31 January 2025 by Cao, M., Shao, Z., et al.
Fig.3.E

-
WB
-
Collected and cropped from Cell Death Dis by CiteAb, provided under a CC-BY license
Image 1 of 404
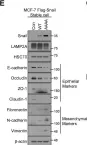
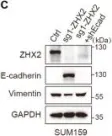
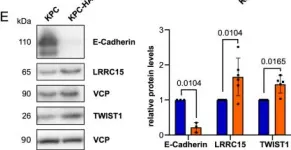
In Mol Cancer on 11 October 2024 by Ryu, K. J., Lee, K. W., et al.
Fig.4.E

-
WB
-
Collected and cropped from Mol Cancer by CiteAb, provided under a CC-BY license
Image 1 of 404
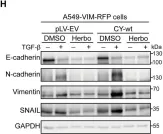
In Nat Commun on 9 September 2024 by Hung, C. H., Wu, S. Y., et al.
Fig.3.E

-
WB
-
Collected and cropped from Nat Commun by CiteAb, provided under a CC-BY license
Image 1 of 404
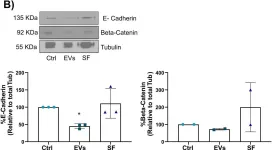
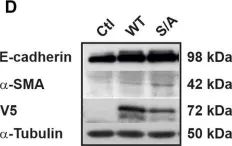
In Sci Rep on 6 August 2024 by Dietrich, N., Castellanos-Martínez, R., et al.
Fig.2.A

-
WB
-
Mus musculus (House mouse)
Collected and cropped from Sci Rep by CiteAb, provided under a CC-BY license
Image 1 of 404
In Sci Rep on 6 August 2024 by Dietrich, N., Castellanos-Martínez, R., et al.
Fig.3.B

-
WB
-
Mus musculus (House mouse)
Collected and cropped from Sci Rep by CiteAb, provided under a CC-BY license
Image 1 of 404
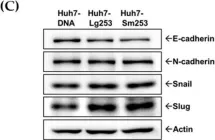
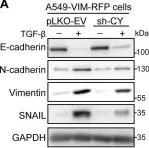
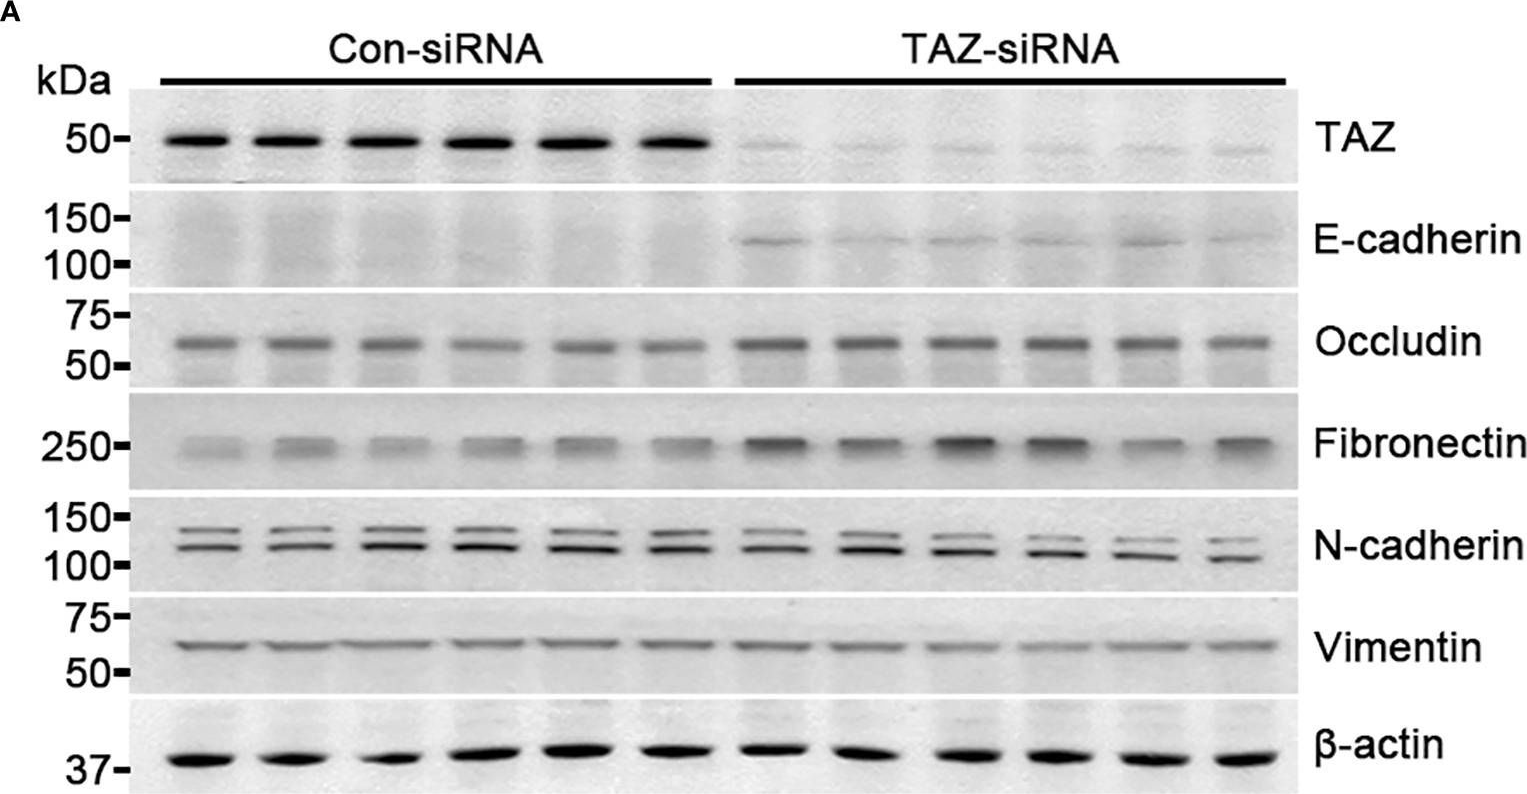
In Front Oncol on 22 May 2024 by Choi, H. S., Jang, H. J., et al.
Fig.2.A
-
WB
-
Homo sapiens (Human)
Collected and cropped from Front Oncol by CiteAb, provided under a CC-BY license
Image 1 of 404
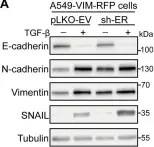
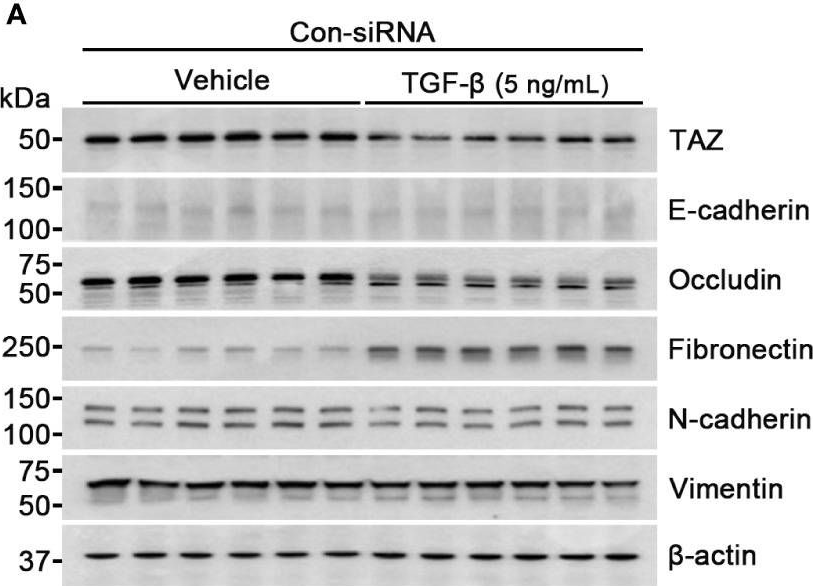
In Front Oncol on 22 May 2024 by Choi, H. S., Jang, H. J., et al.
Fig.3.A
-
WB
-
Homo sapiens (Human)
Collected and cropped from Front Oncol by CiteAb, provided under a CC-BY license
Image 1 of 404
In Viruses on 21 May 2024 by Juang, H. H., Hsu, C. W., et al.
Fig.6.C

-
WB
-
Collected and cropped from Viruses by CiteAb, provided under a CC-BY license
Image 1 of 404
In Front Oncol on 7 February 2024 by Besso, M. J., Rosso, M., et al.
Fig.3.B

-
WB
-
Collected and cropped from Front Oncol by CiteAb, provided under a CC-BY license
Image 1 of 404
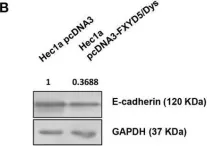
In Front Cell Dev Biol on 29 November 2023 by Nguyen, T. V. H., Bergmann, U., et al.
Fig.4.D

-
WB
-
Homo sapiens (Human)
Collected and cropped from Front Cell Dev Biol by CiteAb, provided under a CC-BY license
Image 1 of 404
In Sci Rep on 22 November 2023 by Matsuoka, Y. & Tsujimoto, Y.
Fig.5.D

-
WB
-
Mus musculus (House mouse)
Collected and cropped from Sci Rep by CiteAb, provided under a CC-BY license
Image 1 of 404
In Sci Rep on 22 November 2023 by Matsuoka, Y. & Tsujimoto, Y.
Fig.4.G

-
WB
-
Mus musculus (House mouse)
Collected and cropped from Sci Rep by CiteAb, provided under a CC-BY license
Image 1 of 404
In Sci Rep on 28 July 2023 by Schwebler, J., Fey, C., et al.
Fig.4.A

-
IHC
-
Homo sapiens (Human)
Collected and cropped from Sci Rep by CiteAb, provided under a CC-BY license
Image 1 of 404
In Cell Death Dis on 17 July 2023 by He, Y., Zhang, Q., et al.
Fig.4.C

-
WB
-
Collected and cropped from Cell Death Dis by CiteAb, provided under a CC-BY license
Image 1 of 404
In Cell Death Dis on 17 July 2023 by He, Y., Zhang, Q., et al.
Fig.2.C

-
WB
-
Collected and cropped from Cell Death Dis by CiteAb, provided under a CC-BY license
Image 1 of 404
In Cell Death Dis on 17 July 2023 by He, Y., Zhang, Q., et al.
Fig.2.D

-
WB
-
Collected and cropped from Cell Death Dis by CiteAb, provided under a CC-BY license
Image 1 of 404
In Cell Death Dis on 17 July 2023 by He, Y., Zhang, Q., et al.
Fig.2.A

-
WB
-
Collected and cropped from Cell Death Dis by CiteAb, provided under a CC-BY license
Image 1 of 404
In Cell Death Dis on 17 July 2023 by He, Y., Zhang, Q., et al.
Fig.2.B

-
WB
-
Collected and cropped from Cell Death Dis by CiteAb, provided under a CC-BY license
Image 1 of 404
In Cells on 9 July 2023 by Cai, T., Peng, J., et al.
Fig.2.C

-
WB
-
Canis lupus familiaris (Domestic dog)
Collected and cropped from Cells by CiteAb, provided under a CC-BY license
Image 1 of 404
In Nat Commun on 24 April 2023 by Wiedmann, L., De Angelis Rigotti, F., et al.
Fig.2.E

-
WB
-
Mus musculus (House mouse)
Collected and cropped from Nat Commun by CiteAb, provided under a CC-BY license
Image 1 of 404
In Cell Mol Life Sci on 17 January 2023 by Zhang, J., Van Dinther, M., et al.
Fig.6.H

-
WB
-
Collected and cropped from Cell Mol Life Sci by CiteAb, provided under a CC-BY license
Image 1 of 404
In Cell Mol Life Sci on 17 January 2023 by Zhang, J., Van Dinther, M., et al.
Fig.3.A

-
WB
-
Collected and cropped from Cell Mol Life Sci by CiteAb, provided under a CC-BY license
Image 1 of 404
In Cell Mol Life Sci on 17 January 2023 by Zhang, J., Van Dinther, M., et al.
Fig.2.A

-
WB
-
Collected and cropped from Cell Mol Life Sci by CiteAb, provided under a CC-BY license
Image 1 of 404