


Neural cell adhesion molecule (NCAM), a common mammalian cell surface glycoprotein, is the major substrate of polysialic acid (polySia). Polysialylated NCAM occurs in many types of cancer, but rarely in normal adult tissues. The functional role of NCAM hypersialylation in the epithelial-mesenchymal transition (EMT) process remains unclear. The present study indicates that NCAM and attached polysialic acid affect behaviors of breast epithelial cells through differential signaling pathways. NCAM and polysialylated NCAM are aberrantly regulated in breast cancer cells. They are both upregulated in normal breast epithelial cells undergoing EMT. Western blot analysis demonstrates that NCAM-140 overexpression induces EMT in breast epithelial cells and promotes cell proliferation and migration through activation of the β-catenin/slug signaling pathway. Modification of polySia attached to NCAM modulates cell adhesion and promotes cell motility through activation of the EGFR/STAT3 pathway. These observations contribute to clarifying the molecular mechanisms by which polysialic acid and its major substrate, NCAM, modulate cell behaviors, and highlight the significance of increased polysialylated expression on NCAM during EMT and tumor development.
Product Citations: 77
In Acta Biochimica et Biophysica Sinica on 15 October 2024 by Wu, Y., Yang, J., et al.
In Nature Communications on 9 September 2024 by Hung, C. H., Wu, S. Y., et al.
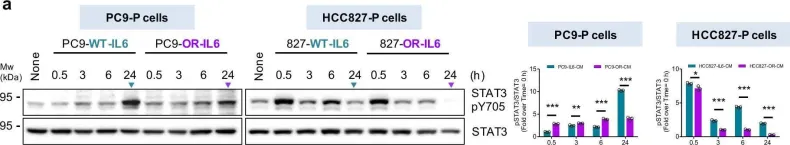
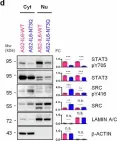
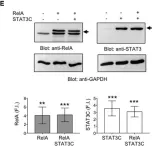
The IL6-GP130-STAT3 pathway facilitates lung cancer progression and resistance to tyrosine kinase inhibitors. Although glycosylation alters the stability of GP130, its effect on the ligand IL6 remains unclear. We herein find that N-glycosylated IL6, especially at Asn73, primarily stimulates JAK-STAT3 signaling and prolongs STAT3 phosphorylation, whereas N-glycosylation-defective IL6 (deNG-IL6) induces shortened STAT3 activation and alters the downstream signaling preference for the SRC-YAP-SOX2 axis. This signaling shift induces epithelial-mesenchymal transition (EMT) and migration in vitro and metastasis in vivo, which are suppressed by targeted inhibitors and shRNAs against SRC, YAP, and SOX2. Osimertinib-resistant lung cancer cells secrete a large amount of deNG-IL6 through reduced N-glycosyltransferase gene expression, leading to clear SRC-YAP activation. deNG-IL6 contributes to drug resistance, as confirmed by in silico analysis of cellular and clinical transcriptomes and signal expression in patient specimens. Therefore, the N-glycosylation status of IL6 not only affects cell behaviors but also shows promise in monitoring the dynamics of lung cancer evolution.
© 2024. The Author(s).
-
WB
-
Homo sapiens (Human)
-
Cancer Research
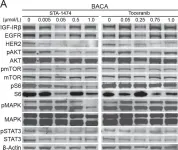
In Molecular Oncology on 1 August 2023 by Chang, Y. T., Peng, H. Y., et al.
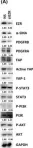
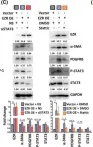
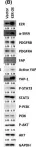
Cancer-associated fibroblasts (CAFs), a major component of the tumor microenvironment (TME) in pancreatic ductal adenocarcinoma (PDAC), play an important role in tumorigenesis, metastasis, and chemoresistance. Tumor-derived small extracellular vesicles (sEVs), which mediate cell-to-cell communication between cancer cells and fibroblasts, are also critical for cancer progression and metastasis. However, it remains unclear how PDAC cell-derived sEVs activate fibroblasts, which contributes to tumor progression. Here, we report that ezrin (EZR) expression in PDAC cell-derived sEVs (sEV-EZR) can activate fibroblasts, resulting in increased migration ability and high expression of α-SMA, PDGFRB, and high production of extracellular matrix in fibroblasts. Reciprocally, sEV-EZR-activated fibroblasts enhanced PDAC cell proliferation, invasion, and metastasis to the liver in animal models. Conversely, fibroblasts treated with PDAC cell-derived sEVs with EZR knockdown resulted in the reduced metastatic ability of PDAC. Mechanistically, we demonstrated that PDAC cell-derived sEV-EZR increases the STAT3 and YAP-1 signaling pathways to induce fibroblast activation, and the activated fibroblasts promote PDAC cell proliferation, invasion, and liver metastasis. Inhibition of the STAT3 and YAP-1 signaling pathways by gene knockdown can abrogate sEV-EZR-induced effects. These findings suggest that targeting the interaction between PDAC cell-derived sEV-EZR and fibroblasts is a potential therapeutic strategy for PDAC.
© 2023 The Authors. Molecular Oncology published by John Wiley & Sons Ltd on behalf of Federation of European Biochemical Societies.
-
WB
-
Cancer Research
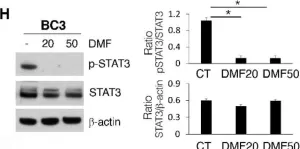
Mechanisms of Sensitivity and Resistance of Primary Effusion Lymphoma to Dimethyl Fumarate (DMF).
In International Journal of Molecular Sciences on 17 June 2022 by Gonnella, R., Zarrella, R., et al.
PEL is a rare B cell lymphoma associated with KSHV that mainly arises in immune-deficient individuals. The search for new drugs to treat this cancer is still ongoing given its aggressiveness and the poor response to chemotherapies. In this study, we found that DMF, a drug known for its anti-inflammatory properties which is registered for the treatment of psoriasis and relapsing-remitting MS, could be a promising therapeutic strategy against PEL. Indeed, although some mechanisms of resistance were induced, DMF activated NRF2, reduced ROS and inhibited the phosphorylation of STAT3 and the release of the pro-inflammatory and immune suppressive cytokines IL-6 and IL-10, which are known to sustain PEL survival. Interestingly, we observed that DMF displayed a stronger cytotoxic effect against fresh PEL cells in comparison to PEL cell lines, due to the activation of ERK1/2 and autophagy in the latter cells. This finding further encourages the possibility of using DMF for the treatment of PEL.
-
WB
-
Cancer Research
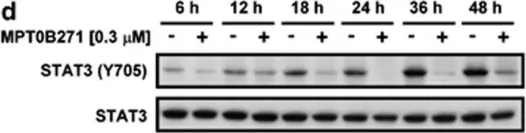
In Cell Death and Differentiation on 1 February 2022 by Kudo, M., Zalles, N., et al.
MicroRNAs (miRNAs) are small noncoding RNAs that act as endogenous regulatory molecules targeting specific mRNAs for translational repression. Studies of breast cancer genomics indicate that breast cancer subtypes are distinguished and regulated by specific sets of miRNAs which affect activities such as tumor initiation, progression, and even drug response. Polo-like Kinase 1 (PLK1) is widely considered to be a proto-oncogene due to its increased expression in multiple tumor types, as well as its crucial role in regulating mitosis. Pharmacological inhibition of PLK1 can reduce tumor volume and induce tumor cell death in solid and hematologic malignancies. This prompted us to investigate how PLK1 inhibition with the target-specific inhibitor NMS-P937 would impact breast cancer cells, and how miRNAs may influence the overall response of these cells to this inhibition. We found that miR-183-5p targets PLK1 gene, effectively reducing its protein expression. Such miRNA-driven regulation of PLK1 expression sensitizes breast cancer cells to NMS-P937, resulting in synergistically increased apoptosis. We also show that the miRNA-regulated reduction of PLK1 influences the expression of apoptosis-related key proteins and possibly inducing further indirect PLK1 downmodulation through a DNMT1-p53 axis. These results suggest a potential biologically significant link between the expression of miR-183-5p and the efficacy of PLK1-specific inhibitors in breast cancer cells. Our work further elucidates how miR-183-5p regulates PLK1 gene while also enhancing NMS-P937 effect in breast cancer. Future studies assessing the role of miR-183-5p as a novel biomarker for anti-PLK1 chemotherapy agents are warranted.
© 2021. The Author(s).
-
WB
-
Homo sapiens (Human)
-
Cancer Research
-
Cell Biology
In Nat Commun on 9 September 2024 by Hung, C. H., Wu, S. Y., et al.
Fig.2.E

-
WB
-
Homo sapiens (Human)
Collected and cropped from Nat Commun by CiteAb, provided under a CC-BY license
Image 1 of 22
In Nat Commun on 9 September 2024 by Hung, C. H., Wu, S. Y., et al.
Fig.7.A

-
WB
-
Collected and cropped from Nat Commun by CiteAb, provided under a CC-BY license
Image 1 of 22
In Nat Commun on 9 September 2024 by Hung, C. H., Wu, S. Y., et al.
Fig.4.D

-
WB
-
Collected and cropped from Nat Commun by CiteAb, provided under a CC-BY license
Image 1 of 22
In Mol Oncol on 1 August 2023 by Chang, Y. T., Peng, H. Y., et al.
Fig.5.A

-
WB
-
Collected and cropped from Mol Oncol by CiteAb, provided under a CC-BY license
Image 1 of 22
In Mol Oncol on 1 August 2023 by Chang, Y. T., Peng, H. Y., et al.
Fig.5.D

-
WB
-
Collected and cropped from Mol Oncol by CiteAb, provided under a CC-BY license
Image 1 of 22
In Mol Oncol on 1 August 2023 by Chang, Y. T., Peng, H. Y., et al.
Fig.5.C

-
WB
-
Collected and cropped from Mol Oncol by CiteAb, provided under a CC-BY license
Image 1 of 22
In Mol Oncol on 1 August 2023 by Chang, Y. T., Peng, H. Y., et al.
Fig.5.B

-
WB
-
Collected and cropped from Mol Oncol by CiteAb, provided under a CC-BY license
Image 1 of 22
In Int J Mol Sci on 17 June 2022 by Gonnella, R., Zarrella, R., et al.
Fig.1.H

-
WB
-
Collected and cropped from Int J Mol Sci by CiteAb, provided under a CC-BY license
Image 1 of 22
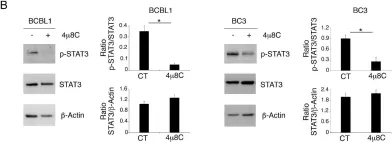
In Biomedicines on 27 January 2021 by Gonnella, R., Gilardini Montani, M. S., et al.
Fig.2.B

-
WB
-
Collected and cropped from Biomedicines by CiteAb, provided under a CC-BY license
Image 1 of 22
In Front Immunol on 10 May 2019 by Kunkl, M., Mastrogiovanni, M., et al.
Fig.5.E

-
WB
-
Collected and cropped from Front Immunol by CiteAb, provided under a CC-BY license
Image 1 of 22
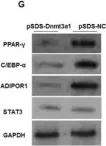
In Front Physiol on 20 October 2018 by Abdalla, B. A., Li, Z., et al.
Fig.6.G

-
WB
-
Collected and cropped from Front Physiol by CiteAb, provided under a CC-BY license
Image 1 of 22
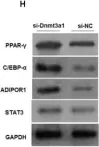
In Front Physiol on 20 October 2018 by Abdalla, B. A., Li, Z., et al.
Fig.6.H

-
WB
-
Collected and cropped from Front Physiol by CiteAb, provided under a CC-BY license
Image 1 of 22
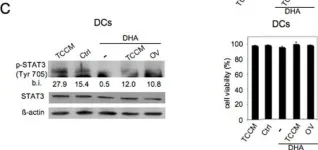
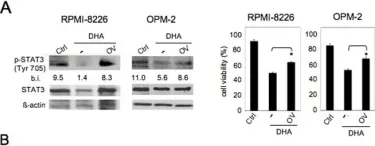
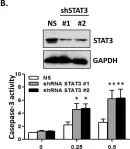
In Genes Cancer on 1 January 2017 by D'Eliseo, D., Di Renzo, L., et al.
Fig.6.C

-
WB
-
Homo sapiens (Human)
Collected and cropped from Genes Cancer by CiteAb, provided under a CC-BY license
Image 1 of 22
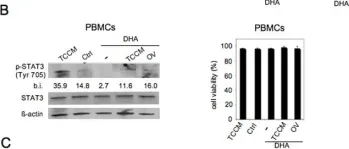
In Genes Cancer on 1 January 2017 by D'Eliseo, D., Di Renzo, L., et al.
Fig.6.B

-
WB
-
Homo sapiens (Human)
Collected and cropped from Genes Cancer by CiteAb, provided under a CC-BY license
Image 1 of 22
In Genes Cancer on 1 January 2017 by D'Eliseo, D., Di Renzo, L., et al.
Fig.6.A

-
WB
-
Homo sapiens (Human)
Collected and cropped from Genes Cancer by CiteAb, provided under a CC-BY license
Image 1 of 22
In PLoS One on 2 July 2016 by Peng, H. Y., Cheng, Y. C., et al.
Fig.3.B

-
WB
-
Homo sapiens (Human)
Collected and cropped from PLoS One by CiteAb, provided under a CC-BY license
Image 1 of 22
In PLoS One on 13 November 2015 by Clemente-Vicario, F., Alvarez, C. E., et al.
Fig.5.A

-
WB
-
Collected and cropped from PLoS One by CiteAb, provided under a CC-BY license
Image 1 of 22
In Cell Death Dis on 10 April 2014 by Tsai, A. C., Wang, C. Y., et al.
Fig.5.D

-
WB
-
Homo sapiens (Human)
Collected and cropped from Cell Death Dis by CiteAb, provided under a CC-BY license
Image 1 of 22
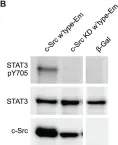
In PLoS One on 8 August 2013 by Irtegun, S., Wood, R. J., et al.
Fig.2.B

-
WB
-
Collected and cropped from PLoS One by CiteAb, provided under a CC-BY license
Image 1 of 22
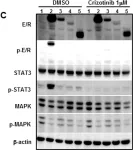
In PLoS One on 8 August 2013 by Irtegun, S., Wood, R. J., et al.
Fig.3.B

-
WB
-
Collected and cropped from PLoS One by CiteAb, provided under a CC-BY license
Image 1 of 22
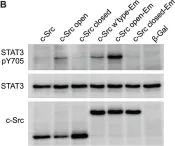
In PLoS One on 8 August 2013 by Irtegun, S., Wood, R. J., et al.
Fig.1.B

-
WB
-
Collected and cropped from PLoS One by CiteAb, provided under a CC-BY license
Image 1 of 22
In PLoS One on 19 February 2013 by Arai, Y., Totoki, Y., et al.
Fig.2.C

-
WB
-
Mus musculus (House mouse)
Collected and cropped from PLoS One by CiteAb, provided under a CC-BY license
Image 1 of 22