Deciphering the intricate dynamic events governing type I interferon (IFN) signaling is critical to unravel key regulatory mechanisms in host antiviral defense. Here, we leverage TurboID-based proximity labeling coupled with affinity purification-mass spectrometry to comprehensively map the proximal human proteomes of all seven canonical type I IFN signaling cascade members under basal and IFN-stimulated conditions. This uncovers a network of 103 high-confidence proteins in close proximity to the core members IFNAR1, IFNAR2, JAK1, TYK2, STAT1, STAT2, and IRF9, and validates several known constitutive protein assemblies, while also revealing novel stimulus-dependent and -independent associations between key signaling molecules. Functional screening further identifies PJA2 as a negative regulator of IFN signaling via its E3 ubiquitin ligase activity. Mechanistically, PJA2 interacts with TYK2 and JAK1, promotes their non-degradative ubiquitination, and limits the activating phosphorylation of TYK2 thereby restraining downstream STAT signaling. Our high-resolution proximal protein landscapes provide global insights into the type I IFN signaling network, and serve as a valuable resource for future exploration of its functional complexities.
© 2024. The Author(s).
Product Citations: 22
In Nature Communications on 27 May 2024 by Schiefer, S. & Hale, B. G.
Preprint on BioRxiv : the Preprint Server for Biology on 6 October 2023 by Schiefer, S. & Hale, B. G.
Deciphering the intricate dynamic events governing type I interferon (IFN) signaling is critical to unravel key regulatory mechanisms in host antiviral defense. Here, we leveraged TurboID-based proximity labeling coupled with affinity purification-mass spectrometry to comprehensively map the proximal proteomes of all seven canonical human type I IFN signaling cascade members under basal and IFN-stimulated conditions. This established a network of 103 proteins in close proximity to the core members IFNAR1, IFNAR2, JAK1, TYK2, STAT1, STAT2, and IRF9. We validated several known constitutive protein assemblies, while also revealing novel stimulus-dependent and -independent associations between key signaling molecules. Functional screening further identified PJA2 as a negative regulator of IFN signaling via its E3 ubiquitin ligase activity. Mechanistically, PJA2 interacts with the Janus kinases, TYK2 and JAK1, and promotes their non-lysine and non-degradative ubiquitination, resulting in restrained downstream STAT signaling. Our high-resolution proximal protein landscapes provide global insights into the type I IFN signaling network, and serve as a valuable resource for future exploration of its functional complexities.
In The Journal of Biological Chemistry on 1 August 2023 by Hernandez, L. M., Montersino, A., et al.
Janus Kinase-1 (JAK1) plays key roles during neurodevelopment and following neuronal injury, while activatory JAK1 mutations are linked to leukemia. In mice, Jak1 genetic deletion results in perinatal lethality, suggesting non-redundant roles and/or regulation of JAK1 for which other JAKs cannot compensate. Proteomic studies reveal that JAK1 is more likely palmitoylated compared to other JAKs, implicating palmitoylation as a possible JAK1-specific regulatory mechanism. However, the importance of palmitoylation for JAK1 signaling has not been addressed. Here, we report that JAK1 is palmitoylated in transfected HEK293T cells and endogenously in cultured Dorsal Root Ganglion (DRG) neurons. We further use comprehensive screening in transfected non-neuronal cells and shRNA-mediated knockdown in DRG neurons to identify the related enzymes ZDHHC3 and ZDHHC7 as dominant protein acyltransferases (PATs) for JAK1. Surprisingly, we found palmitoylation minimally affects JAK1 localization in neurons, but is critical for JAK1's kinase activity in cells and even in vitro. We propose this requirement is likely because palmitoylation facilitates transphosphorylation of key sites in JAK1's activation loop, a possibility consistent with structural models of JAK1. Importantly, we demonstrate a leukemia-associated JAK1 mutation overrides the palmitoylation-dependence of JAK1 activity, potentially explaining why this mutation is oncogenic. Finally, we show that JAK1 palmitoylation is important for neuropoietic cytokine-dependent signaling and neuronal survival and that combined Zdhhc3/7 loss phenocopies loss of palmitoyl-JAK1. These findings provide new insights into the control of JAK signaling in both physiological and pathological contexts.
Copyright © 2023 The Authors. Published by Elsevier Inc. All rights reserved.
-
Biochemistry and Molecular biology
-
Neuroscience
Selective inhibitors of JAK1 targeting an isoform-restricted allosteric cysteine.
In Nature Chemical Biology on 1 December 2022 by Kavanagh, M. E., Horning, B. D., et al.
The Janus tyrosine kinase (JAK) family of non-receptor tyrosine kinases includes four isoforms (JAK1, JAK2, JAK3, and TYK2) and is responsible for signal transduction downstream of diverse cytokine receptors. JAK inhibitors have emerged as important therapies for immun(onc)ological disorders, but their use is limited by undesirable side effects presumed to arise from poor isoform selectivity, a common challenge for inhibitors targeting the ATP-binding pocket of kinases. Here we describe the chemical proteomic discovery of a druggable allosteric cysteine present in the non-catalytic pseudokinase domain of JAK1 (C817) and TYK2 (C838), but absent from JAK2 or JAK3. Electrophilic compounds selectively engaging this site block JAK1-dependent trans-phosphorylation and cytokine signaling, while appearing to act largely as 'silent' ligands for TYK2. Importantly, the allosteric JAK1 inhibitors do not impair JAK2-dependent cytokine signaling and are inactive in cells expressing a C817A JAK1 mutant. Our findings thus reveal an allosteric approach for inhibiting JAK1 with unprecedented isoform selectivity.
© 2022. The Author(s), under exclusive licence to Springer Nature America, Inc.
BRD9 is a druggable component of interferon-stimulated gene expression and antiviral activity.
In EMBO Reports on 5 October 2021 by Börold, J., Eletto, D., et al.
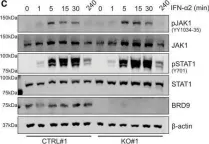
Interferon (IFN) induction of IFN-stimulated genes (ISGs) creates a formidable protective antiviral state. However, loss of appropriate control mechanisms can result in constitutive pathogenic ISG upregulation. Here, we used genome-scale loss-of-function screening to establish genes critical for IFN-induced transcription, identifying all expected members of the JAK-STAT signaling pathway and a previously unappreciated epigenetic reader, bromodomain-containing protein 9 (BRD9), the defining subunit of non-canonical BAF (ncBAF) chromatin-remodeling complexes. Genetic knockout or small-molecule-mediated degradation of BRD9 limits IFN-induced expression of a subset of ISGs in multiple cell types and prevents IFN from exerting full antiviral activity against several RNA and DNA viruses, including influenza virus, human immunodeficiency virus (HIV1), and herpes simplex virus (HSV1). Mechanistically, BRD9 acts at the level of transcription, and its IFN-triggered proximal association with the ISG transcriptional activator, STAT2, suggests a functional localization at selected ISG promoters. Furthermore, BRD9 relies on its intact acetyl-binding bromodomain and unique ncBAF scaffolding interaction with GLTSCR1/1L to promote IFN action. Given its druggability, BRD9 is an attractive target for dampening ISG expression under certain autoinflammatory conditions.
© 2021 The Authors. Published under the terms of the CC BY 4.0 license.
-
WB
-
Homo sapiens (Human)
In EMBO Rep on 5 October 2021 by Börold, J., Eletto, D., et al.
Fig.2.C

-
WB
-
Collected and cropped from EMBO Rep by CiteAb, provided under a CC-BY license
Image 1 of 9
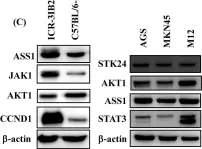
In J Cancer on 2 January 2020 by Hsu, H. P., Wang, C. Y., et al.
Fig.2.C

-
WB
-
Collected and cropped from J Cancer by CiteAb, provided under a CC-BY license
Image 1 of 9
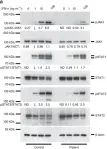
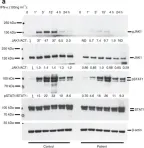
In Nat Commun on 23 December 2016 by Eletto, D., Burns, S. O., et al.
Fig.3.A

-
WB
-
Collected and cropped from Nat Commun by CiteAb, provided under a CC-BY license
Image 1 of 9
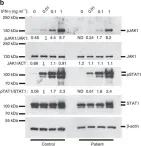
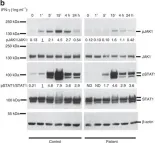
In Nat Commun on 23 December 2016 by Eletto, D., Burns, S. O., et al.
Fig.3.B

-
WB
-
Collected and cropped from Nat Commun by CiteAb, provided under a CC-BY license
Image 1 of 9
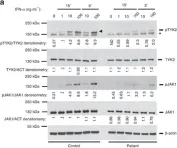
In Nat Commun on 23 December 2016 by Eletto, D., Burns, S. O., et al.
Fig.5.A

-
WB
-
Collected and cropped from Nat Commun by CiteAb, provided under a CC-BY license
Image 1 of 9
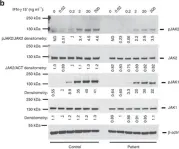
In Nat Commun on 23 December 2016 by Eletto, D., Burns, S. O., et al.
Fig.5.B

-
WB
-
Collected and cropped from Nat Commun by CiteAb, provided under a CC-BY license
Image 1 of 9
In Nat Commun on 23 December 2016 by Eletto, D., Burns, S. O., et al.
Fig.6.A

-
WB
-
Collected and cropped from Nat Commun by CiteAb, provided under a CC-BY license
Image 1 of 9
In Nat Commun on 23 December 2016 by Eletto, D., Burns, S. O., et al.
Fig.6.B

-
WB
-
Collected and cropped from Nat Commun by CiteAb, provided under a CC-BY license
Image 1 of 9
In Nat Commun on 23 December 2016 by Eletto, D., Burns, S. O., et al.
Fig.7.A

-
WB
-
Collected and cropped from Nat Commun by CiteAb, provided under a CC-BY license
Image 1 of 9